Buyers are dominating Polygon market
Polygon (MATICUSD) Price Analysis – October 10
In case the resistance level of $0.90 is penetrated upside by the pressure of the bulls, the resistance level at $1.01 price level may be reached and may extend to the $1.18 level. An interruption of the bullish movement at $0.90 level may send the Polygon towards support levels of $0.74, $0.64 and $0.55.
Key Levels:
Resistance levels: $0.90, $1.01, $1.18
Support levels: $0.74, $0.64, $0.55,
MATIC/USD Long-term Trend: Bullish
MATIC/USD price is on the bullish trend on the Long-term outlook. Last two weeks, Polygon market was dominated by sellers. The price was reduced to the support level of $0.74. Partial bearish breakout was experienced at $0.74 level but the buyers interrupted the downward movement with the formation of bullish engulfing candle. The price is increasing towards the resistance level of $0.90 at the moment.
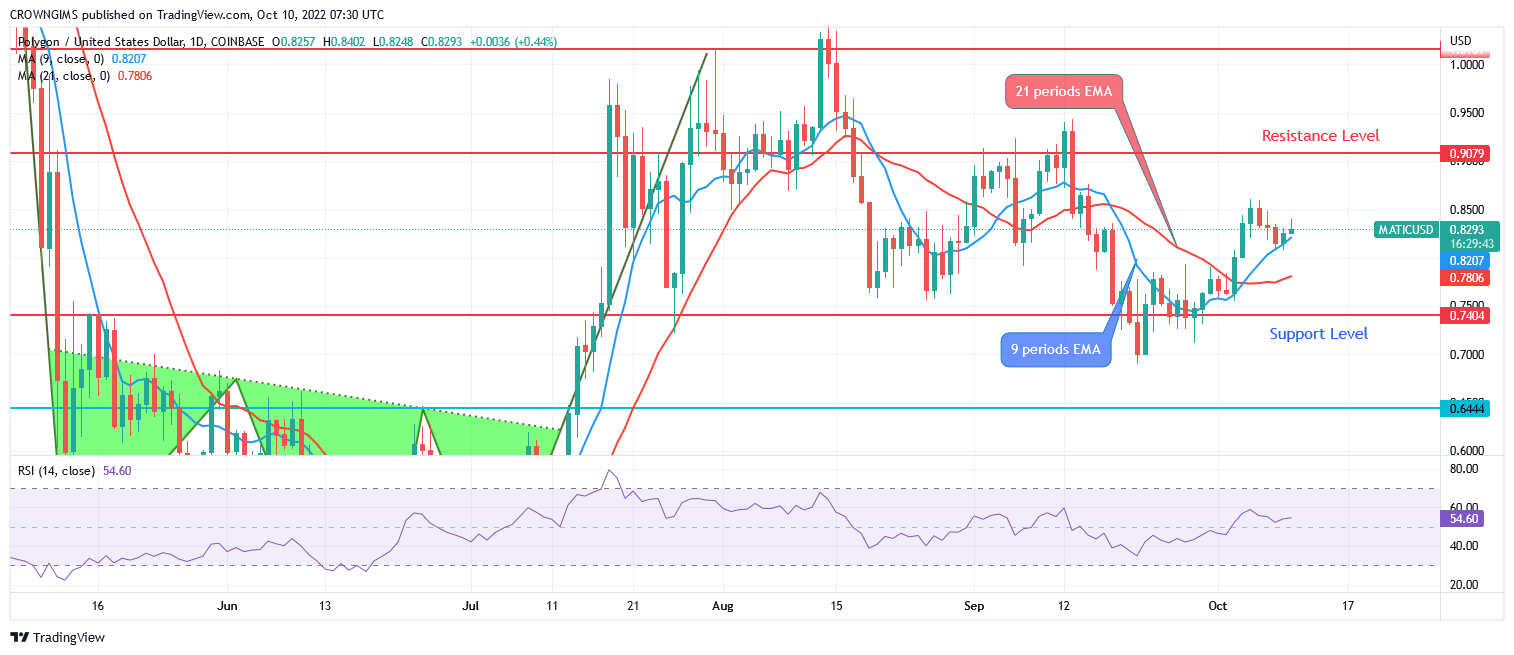
Polygon has penetrated the 9 periods EMA and 21 periods EMA upside. MATIC is trading above the two EMAs at the moment, which connote an increase in the bulls’ momentum. Further increase of the Polygon is highly envisaged. In case the resistance level of $0.90 is penetrated upside by the pressure of the bulls, the resistance level at $1.01 price level may be reached and may extend to the $1.18 level. An interruption of the bullish movement at $0.90 level may send the price towards support levels of $0.74, $0.64 and $0.55.
MATIC/USD Short-term Trend: Bullish
Polygon is bullish on the medium-term outlook. The double bottom chart pattern formed at the support level of $0.64 triggers a bullish movement on the 4-hour chart. More pressure from the bulls pushes price across the dynamic resistance levels.
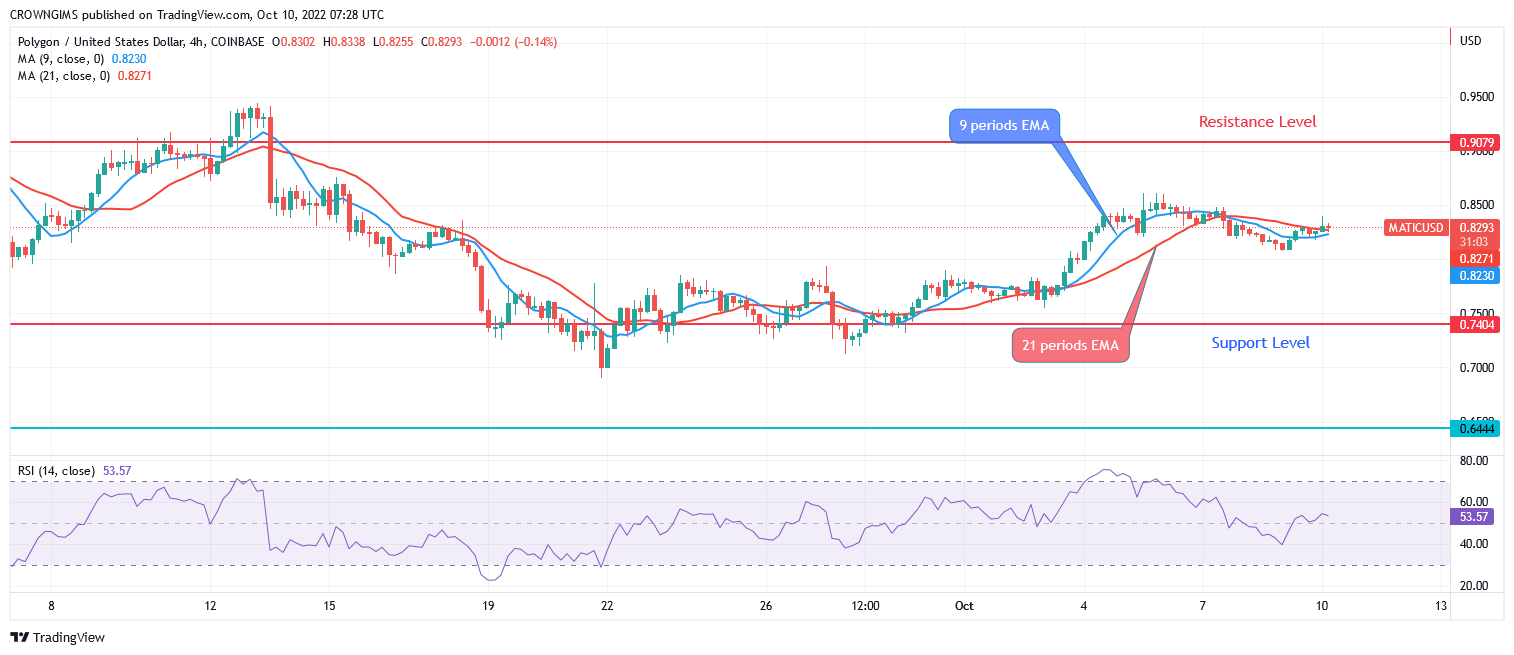
The 9-day EMA is above the 21 periods EMA and the Polygon price is trading above the two EMAs. The relative strength index period 14 is at 49 levels with the signal line pointing down which indicate sell signal.
You can purchase crypto coins here. Buy LBLOCK
- Broker
- Min Deposit
- Score
- Visit Broker

- Award-winning Cryptocurrency trading platform
- $100 minimum deposit,
- FCA & Cysec regulated

- 20% welcome bonus of upto $10,000
- Minimum deposit $100
- Verify your account before the bonus is credited
- Fund Moneta Markets account with a minimum of $250
- Opt in using the form to claim your 50% deposit bonus
Learn to Trade
Never Miss A Trade Again

Signal Notification
Real-time signal notifications whenever a signal is opened, closes or Updated

Get Alerts
Immediate alerts to your email and mobile phone.

Entry Price Levels
Entry price level for every signal Just choose one of our Top Brokers in the list above to get all this free.