

Polkadot (DOT) Price Long-term Trend: Bearish
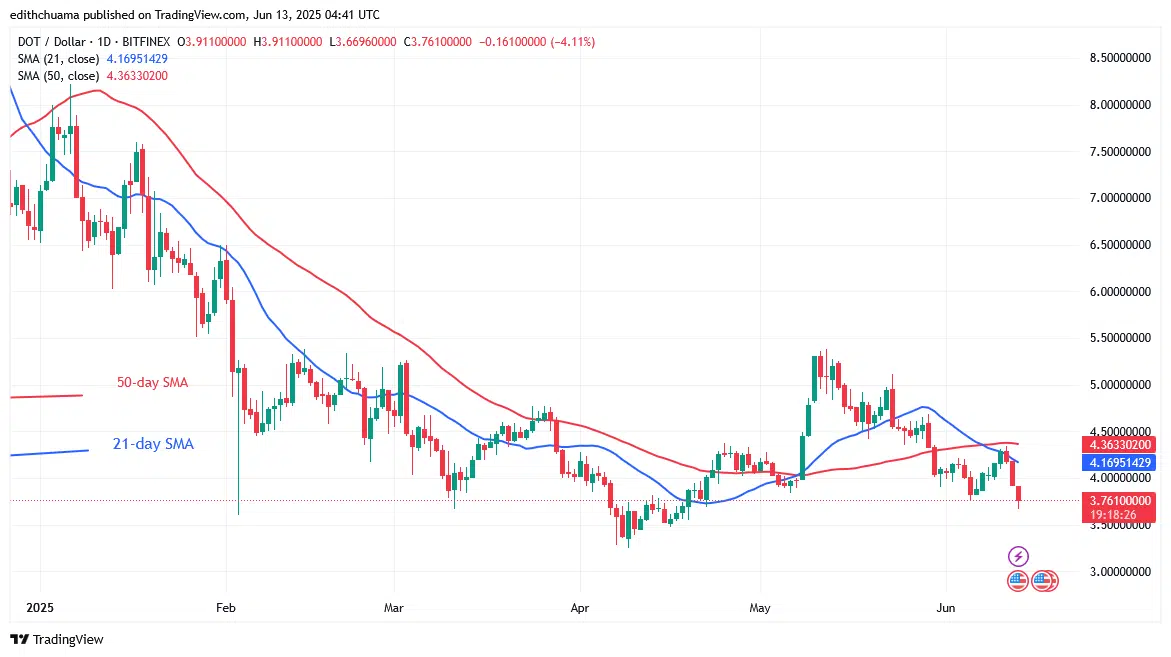
Polkadot’s (DOT) price continues to drop below the critical $4.00 support as it revisits its $3.20 low. The cryptocurrency asset has been trading below the $5.50 resistance but above the $4.00 support. The moving average lines have been impeding the upward rise since May 30. The DOT price broke below the $4.00 support and is currently falling.
The selling pressure is probably going to keep going down to the lows of $3.50 and $3.25. The altcoin has fallen as low as $3.77 today as of this writing. The DOT price will resume a bullish trend if it retraces and stays above $3.50 or $3.25. Meanwhile, the altcoin has continued to lose value.
Technical indicators:
Key Resistance Levels: $10, $12, $14
Key Support Levels: $5, $3, $1
Polkadot Indicator Analysis
The altcoin has been trading in the bearish trend zone since May 30 and the price bars have been below the moving average lines. Indicating a bearish trend, the 21-day SMA has broken below the 50-day SMA. The trend is indicated by the 4-hour chart’s moving average lines, which have kept sloping south.
General Outlook for Polkadot (DOT)
Polkadot is falling as it revisits its $3.20 low from earlier. The bearish trend on the 4-hour chart dipped as low as $3.70 before rising again. Despite the reversal, the altcoin has plunged farther below. In the bearish trend zone, the cryptocurrency signal is negative.

Make money without lifting your fingers: Start using a world-class auto trading solution.
Note: Learn2.Trade is not a financial advisor. Do your research before investing your funds in any financial asset, product, or event. We are not responsible for your investment.


