

Polkadot (DOT) Price Long-term Trend: Bearish
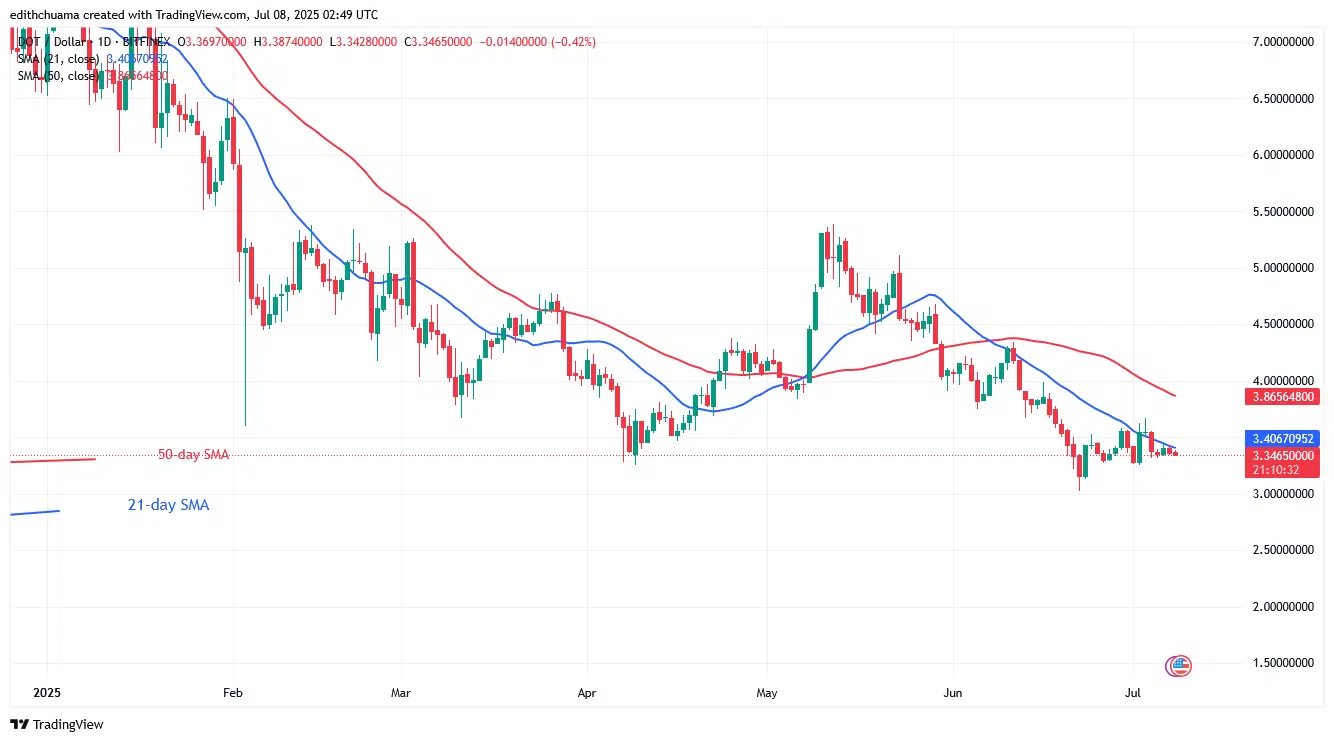
Polkadot’s (DOT) price has been stabilizing at the bottom of the chart amid traders’ disinterest. The negative trend has terminated above $3.02 support. The price movement has remained consistent above the $3.00 support and below the moving average lines.
Since May 30, buyers have failed to move the price above the moving average lines. The 21-day SMA has halted further upward movement in the cryptocurrency. On July 2, the bulls breached above the 21-day SMA, but were pushed back by the 21-day SMA and the $3.60 barrier. This has been the pricing activity during the last two months.
Technical indicators:
Key Resistance Levels: $10, $12, $14
Key Support Levels: $5, $3, $1
Polkadot Indicator Analysis
Following the latest false breakout, the crypto price has fallen below the moving average lines. Doji candlesticks, which have a small body and are indecisive, dominate price action. These candlesticks at the bottom of the chart depict traders who are unsure of the market’s direction.
General Outlook for Polkadot (DOT)
Polkadot continues to trade at the chart’s bottom amid traders’ disinterest. The altcoin has reached the market’s oversold level. If buyers emerge from the market’s oversold region, the DOT price will restart its upward movement. Doji candlesticks, which control price movement, are causing the altcoin to not trend. Polkadot will rise if it rebounds and the bullish momentum remains above the 21-day SMA.

Make money without lifting your fingers: Start using a world-class auto trading solution.
Note: Learn2.Trade is not a financial advisor. Do your research before investing your funds in any financial asset, product, or event. We are not responsible for your investment.


