Key Resistance Levels: $18, $12, $14
Key Support Levels: $10, $6,$4
Polkadot (DOT) Price Long-term Trend: Bullish
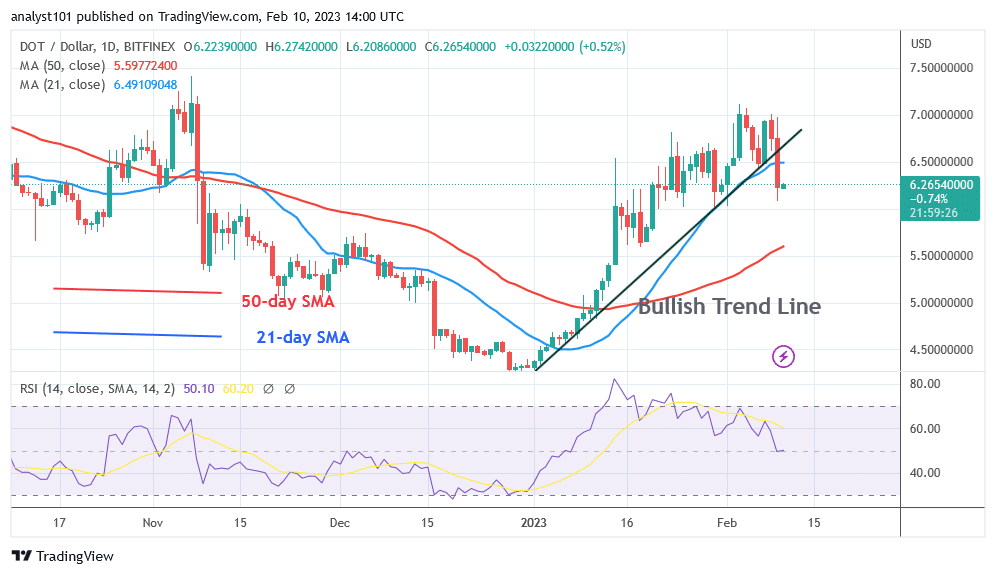
Polkadot (DOT) is trading below its 21-day simple moving average as it approaches the $6.08 low. The cryptocurrency asset has been trading above the $6.00 support level for the past 48 hours. The current slump has reached the market’s oversold level. Polkadot is now fluctuating in price between the moving average lines. Due to its confinement between the moving average lines, the cryptocurrency might be forced to make a range-bound move. The cryptocurrency is therefore above the 50-day SMA but below the 21-day SMA. If the price rises over the moving average lines, the altcoin will resume its positive trend. DOT price will once again reach its $7.00 high. The price of DOT will trend once more if the moving average lines are broken.
Daily Chart Indicators Reading:
For period 14, Polkadot is at level 49 on the Relative Strength Index. It suggests that supply and demand are in equilibrium. However, the price of DOT is likely to continue to fall. The price bars are in between the moving average lines, indicating that the cryptocurrency is trading in a narrow range.
Polkadot (DOT) Medium-term Trend: Bearish
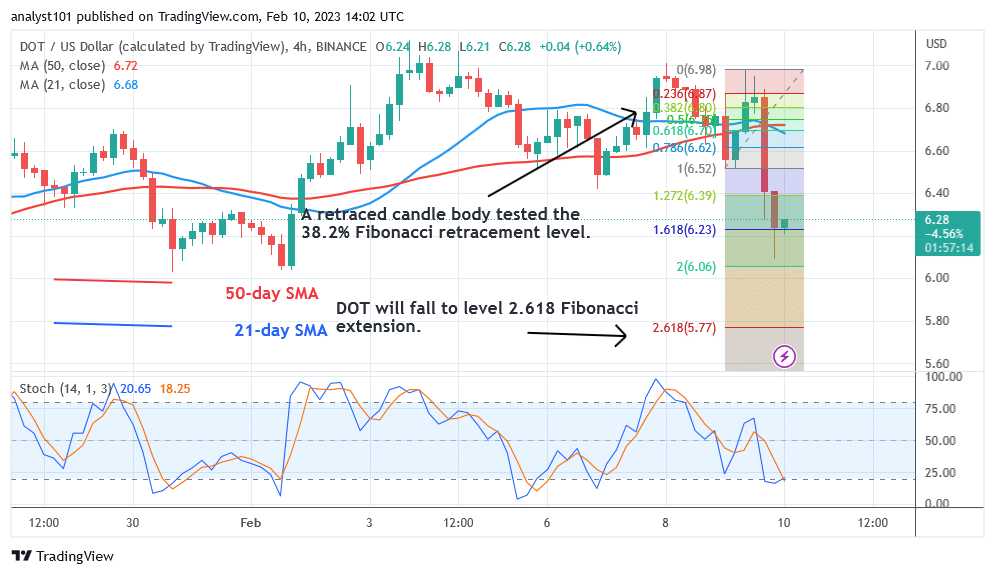
The oversold area of the market is where Polkadot has landed. The pressure to sell is lessening. During the decline of February 9, the DOT price turned upward, and a candle body tested the 38.2% Fibonacci retracement level. The adjustment states that DOT will decrease to level 2.618 of the Fibonacci extension, which equals $5.
4-hour chart Chart Indicators Reading
The daily Stochastic for the altcoin has dropped below level 20. That indicates that the market has oversold. The oversold section of the market will draw buyers.
General Outlook for Polkadot (DOT)
Polkadot is trading above the current support as it approaches the $6.08 low. If the current support persists, the market will increase to its prior high of $7.00. If the altcoin loses the current support, it will fall to its previous low of $5.77.
You can purchase crypto coins here. Buy LBLOCK
Note: Learn2.Trade is not a financial advisor. Do your research before investing your funds in any financial asset or presented product or event. We are not responsible for your investing
- Broker
- Min Deposit
- Score
- Visit Broker

- Award-winning Cryptocurrency trading platform
- $100 minimum deposit,
- FCA & Cysec regulated

- 20% welcome bonus of upto $10,000
- Minimum deposit $100
- Verify your account before the bonus is credited
- Fund Moneta Markets account with a minimum of $250
- Opt in using the form to claim your 50% deposit bonus
Learn to Trade
Never Miss A Trade Again

Signal Notification
Real-time signal notifications whenever a signal is opened, closes or Updated

Get Alerts
Immediate alerts to your email and mobile phone.

Entry Price Levels
Entry price level for every signal Just choose one of our Top Brokers in the list above to get all this free.