Keythe the 6.20 high Resistance Levels: $10, $12, $14
Key Support Levels: $8, $6,$4
Polkadot (DOT) Price Long-term Trend: Bearish
The price of Polkadot (DOT) is falling below the moving average lines as the existing support holds. The decline is approaching the previous low of $5.25. The altcoin has fallen as low as $5.65 as of this writing. The negative trend needs to break below the present support for the price to reach the current low of $5.65. According to the price signal, the downward trend will last until it reaches a low of 5.45 before turning upward. The market will, however, fall to its prior low of $5.25.
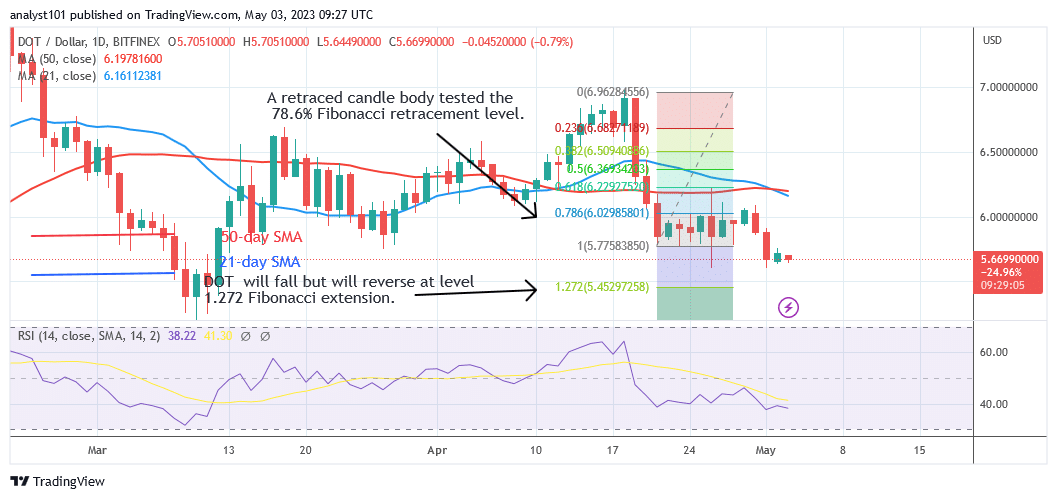
Daily Chart Indicators Reading:
Polkadot is at level 38 on the Relative Strength Index for period 14. The altcoin is now at the very bottom of the chart. The coin will rise past its prior low, which was $5.25.The price bars’ distance from the moving average is what’s causing the current decline.
Polkadot (DOT) Medium-term Trend: Bearish
On the 4-hour chart, Polkadot is gliding sideways after losing money on April 21. The altcoin’s value fluctuates between S5.60 and $6.20. The altcoin has entered the oversold region as long as the existing support holds.
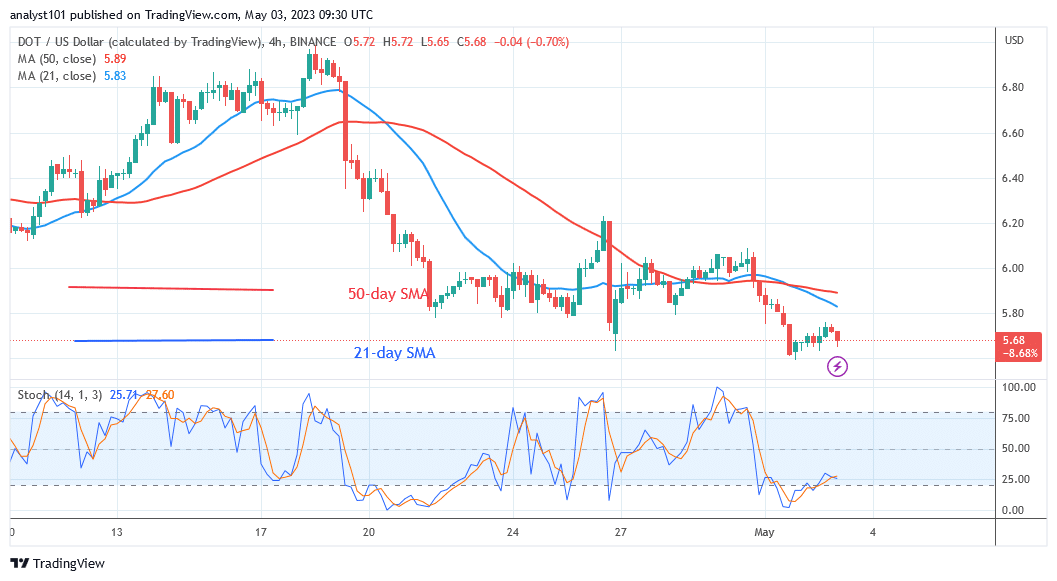
4-hour chart Chart Indicators Reading
Polkadot is trading in the oversold region of the market. It was earlier in the oversold region before the upward trend started up again. Currently, the daily Stochastic is below level 20. The horizontal sloping of the 21-day and 50-day SMAs demonstrates the sideways movement.
General Outlook for Polkadot (DOT)
Polkadot has continued to trade above the $5.60 support as the existing support holds. There is already a sizable candlestick tail indicating that the present support level is under strong buying pressure. If Polkadot can overcome the resistance at $6.20, the upward trend will restart.
You can purchase crypto coins here. Buy LBLOCK
Note: Learn2.Trade is not a financial advisor. Do your research before investing your funds in any financial asset or presented product or event. We are not responsible for your investing
- Broker
- Min Deposit
- Score
- Visit Broker

- Award-winning Cryptocurrency trading platform
- $100 minimum deposit,
- FCA & Cysec regulated

- 20% welcome bonus of upto $10,000
- Minimum deposit $100
- Verify your account before the bonus is credited
- Fund Moneta Markets account with a minimum of $250
- Opt in using the form to claim your 50% deposit bonus
Learn to Trade
Never Miss A Trade Again

Signal Notification
Real-time signal notifications whenever a signal is opened, closes or Updated

Get Alerts
Immediate alerts to your email and mobile phone.

Entry Price Levels
Entry price level for every signal Just choose one of our Top Brokers in the list above to get all this free.