Technical indicators:
Major Resistance Levels – $10, $12, $14
Major Support Levels – $8, $6, $4
DOT/USD Long-term Trend: Bearish
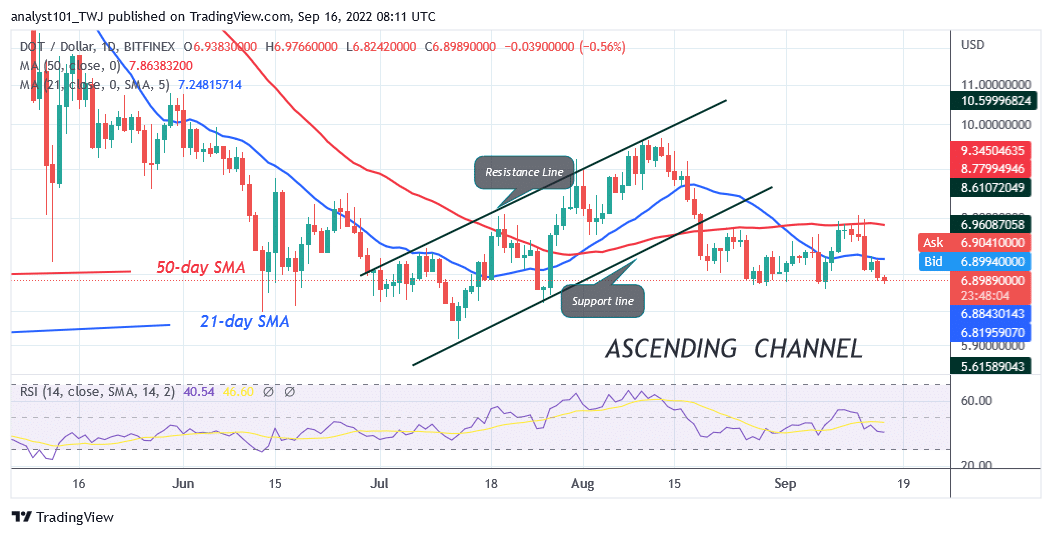
Polkadot’s (DOT) price is in a downtrend as it revisits its previous low at $6.82. It declines above the previous low at $6.82 and resumes consolidation above it. The current support has been holding since August 20 as it retested the current support on three occasions. On the upside, buyers have failed to keep the price above the 50-day line SMA or the $8.00. resistance. They could not sustain the bullish momentum above the recent high. On each rejection, the altcoin would decline above the $6.00 support. On the other hand, if Polkadot rebounds and breaks the 21-day line SMA, the altcoin will rise above the 50-day line SMA. Conversely, Polkadot will further decline to $5.98 low if the selling pressure persists.
Daily Chart Indicators Reading:
Polkadot is at level 39 of the Relative Strength Index for period 14. The cryptocurrency is in the downtrend zone and may further decline. The moving average lines are sloping horizontally indicating the sideways move. The price bars are below the moving average lines which indicates a further decline of the altcoin.
DOT/USD Medium-term bias: Bearish
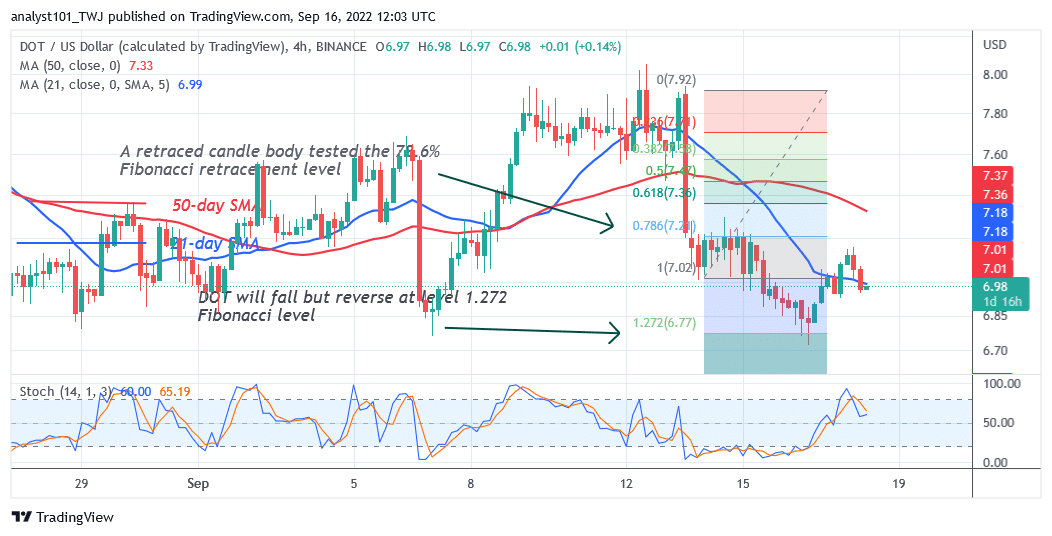
On a 4- hour chart, the DOT price makes an upward correction as price breaks above the 21-day line SMA. Meanwhile, on September 14 downtrend, a retraced candle body tested the 78.6%Fibonacci retracement level. The retracement suggests that DOT will fall but reverse at level 1.272 Fibonacci level or $6.77.
4 – Hour Indicators Reading
DOT price is below the 80% range of the daily stochastic. The market is in a bearish momentum. The 21-day line and 50-day line moving average lines are sloping southward indicating the downtrend.
General Outlook for Polkadot
Polkadot has been in a range-bound move for the past month as it revisits its previous low at $6.82. The uptrend has been hindered at the $8.00 resistance level. Polkadot has been fluctuating between the $6.00 and $8.00 price levels. The altcoin will trend when the range-bound levels are beached.
You can purchase crypto coins here: Buy LBLOCK
Note: Learn2.Trade is not a financial advisor. Do your research before investing your funds in any financial asset or presented product or event. We are not responsible for your investing results
- Broker
- Min Deposit
- Score
- Visit Broker

- Award-winning Cryptocurrency trading platform
- $100 minimum deposit,
- FCA & Cysec regulated

- 20% welcome bonus of upto $10,000
- Minimum deposit $100
- Verify your account before the bonus is credited
- Fund Moneta Markets account with a minimum of $250
- Opt in using the form to claim your 50% deposit bonus
Learn to Trade
Never Miss A Trade Again

Signal Notification
Real-time signal notifications whenever a signal is opened, closes or Updated

Get Alerts
Immediate alerts to your email and mobile phone.

Entry Price Levels
Entry price level for every signal Just choose one of our Top Brokers in the list above to get all this free.