Resistance Levels: $60, $62, $64
Key Support Levels: $40, $38,$36
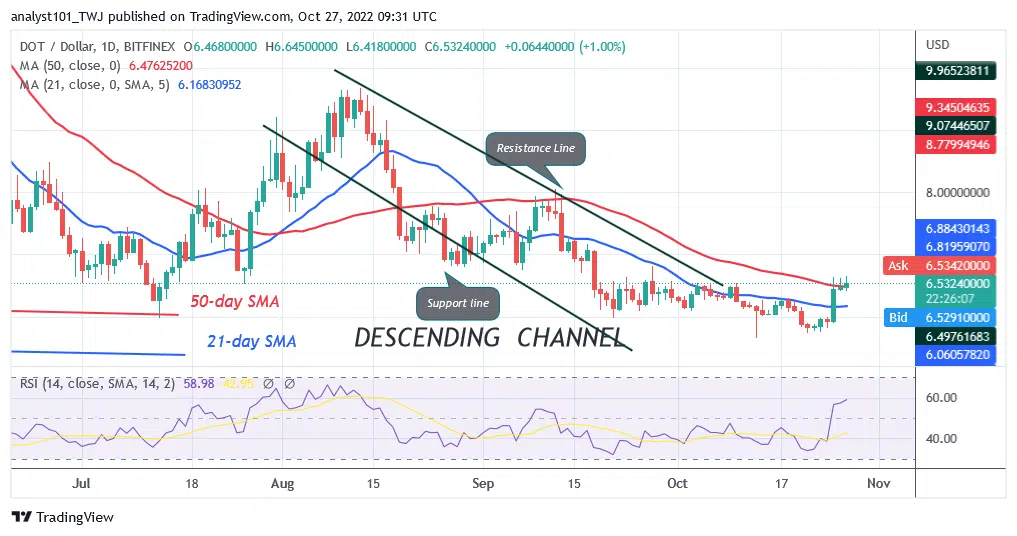
Polkadot (DOT) Price Long-term Trend: Bearish
Polkadot (DOT) is in a downtrend as it challenges the resistance at $6.62. For the past week, the altcoin has been trading above the $5.73 support before its rebound. On October 25, the DOT price rebounded as it broke above the moving average lines. However, the upward move is stuck below the 50-day line SMA. Although it is trading below the 50-day line SMA, the crypto is above the 21-day SMA. When the moving average lines are crossed, the altcoin will trend.. For instance, if the bears break below the 21-day line SMA, DOT price will revisit the previous low at $5.73 and $5.65 price levels.
Daily Chart Indicators Reading:
The DOT price is at level 55 of Relative Strength Index level for period 14. The altcoin is in the bullish trend zone as it rallies to the previous highs. The altcoin will be compelled to a range bound move as the price bars are between the moving average lines. The moving average lines are pointing southward indicating the downtrend.
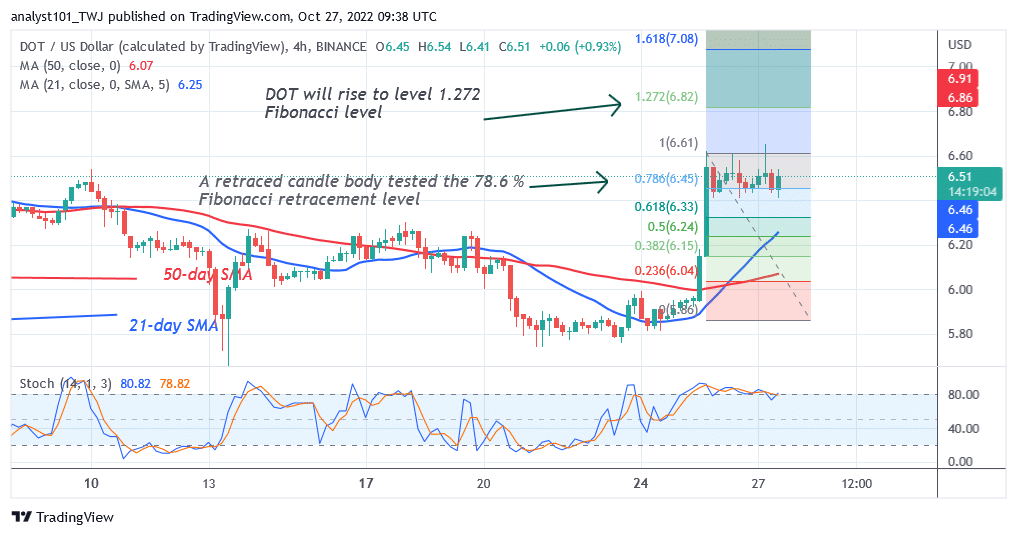
Polkadot (DOT) Medium-term Trend: Bullish
On the 4-hour Chart, the crypto’s price has broken above the moving average lines and rallied to the high of $6.62. Meanwhile, on October 25 uptrend; a retraced candle body tested the 78.6 %Fibonacci retracement level. The retracement implies that DOT will rise but reverse at level 1.272 Fibonacci extension or $6.82.
4-hour chart Chart Indicators Reading
DOT is in a bearish momentum below the 80% range of the daily stochastic. The moving average lines are sloping upward indicating the uptrend.
General Outlook for Polkadot (DOT)
Polkadot is in an upward correction as it challenges the resistance at $6.62. The uptrend is facing rejection at $6.62 high. Presently, the altcoin is fluctuating below the resistance level.
You can purchase crypto coins here. Buy LBLOCK
Note: Learn2.Trade is not a financial advisor. Do your research before investing your funds in any financial asset or presented product or event. We are not responsible for your investing
- Broker
- Min Deposit
- Score
- Visit Broker

- Award-winning Cryptocurrency trading platform
- $100 minimum deposit,
- FCA & Cysec regulated

- 20% welcome bonus of upto $10,000
- Minimum deposit $100
- Verify your account before the bonus is credited
- Fund Moneta Markets account with a minimum of $250
- Opt in using the form to claim your 50% deposit bonus
Learn to Trade
Never Miss A Trade Again

Signal Notification
Real-time signal notifications whenever a signal is opened, closes or Updated

Get Alerts
Immediate alerts to your email and mobile phone.

Entry Price Levels
Entry price level for every signal Just choose one of our Top Brokers in the list above to get all this free.