Key Resistance Levels: $60, $62, $64
Key Support Levels: $40, $38,$36
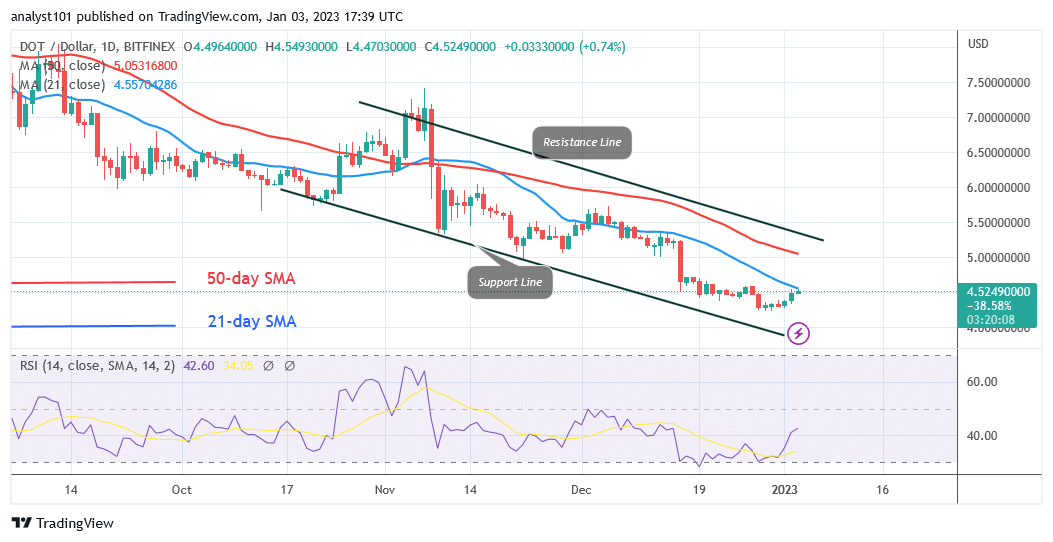
Polkadot (DOT) Price Long-term Trend: Bearish
Following the price decline on December 28, Polkadot (DOT) is now trading at the bottom price level of $4.25. The cryptocurrency asset is currently retesting the 21-day line SMA after making an upward correction. If the price rises over the moving average lines, the altcoin will hit its previous highs of $6.00 and $7.50. If Polkadot’s recent highs are rejected and the price breaks through the existing support, it will continue to fall. Polkadot will lose ground on the downside but might turn around above the $4.00 support. The oversold area of the market for cryptocurrencies has been reached. It’s doubtful if the altcoin will continue to decline.
Daily Chart Indicators Reading:
For period 14, the Relative Strength Index is at level 42. The RSI has increased because of the recent upward correction. The crypto risks a further decline in the bearish trend zone. The price bars are below the moving average lines which indicates a further decline. The altcoin will rise if the price bars are above the moving average lines. The moving average lines are pointing southward.
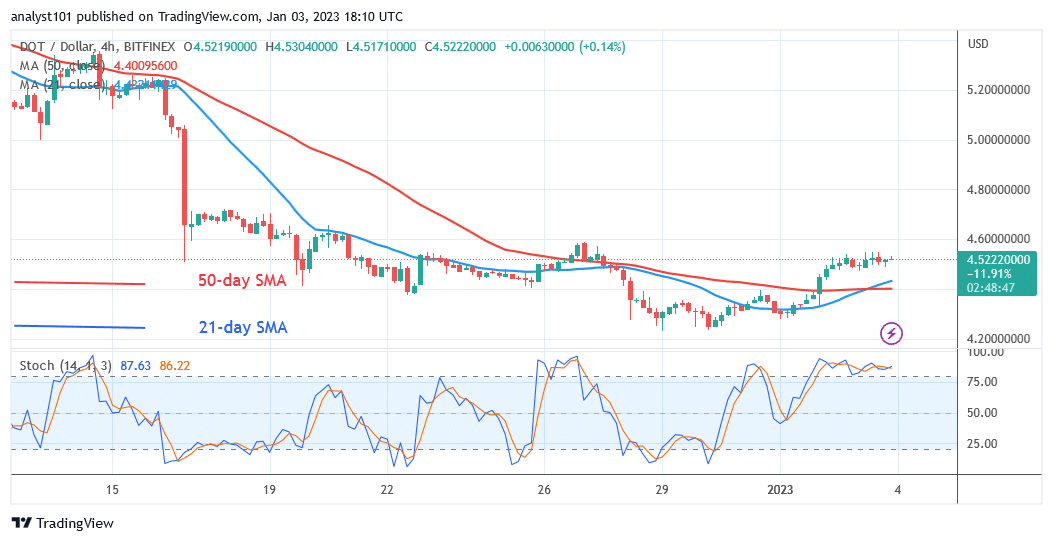
Polkadot (DOT) Medium-term Trend: Bearish
The DOT price is trading above the moving average lines on the 4-hour chart. The cryptocurrency’s upward trend has stalled as it consolidates below the $4.60 resistance level. Doji candlesticks dominate the price action. This explains why buyers and sellers are unsure about the market’s direction.
4-hour chart Chart Indicators Reading
It is above the daily Stochastic level of 80. The overbought area has been reached by the market. If sellers show up in the overbought area of the market, the selling pressure can return. The increasing movement is indicated by the upward-sloping moving average lines.
General Outlook for Polkadot (DOT)
On the chart, Polkadot is trading at the bottom price level of $4.25. Additionally, the market has entered the oversold territory. Prices are unlikely to continue to decline. The altcoin is testing again for a breakdown in the moving average lines.
You can purchase crypto coins here. Buy LBLOCK
Note: Learn2.Trade is not a financial advisor. Do your research before investing your funds in any financial asset or presented product or event. We are not responsible for your investing
- Broker
- Min Deposit
- Score
- Visit Broker

- Award-winning Cryptocurrency trading platform
- $100 minimum deposit,
- FCA & Cysec regulated

- 20% welcome bonus of upto $10,000
- Minimum deposit $100
- Verify your account before the bonus is credited
- Fund Moneta Markets account with a minimum of $250
- Opt in using the form to claim your 50% deposit bonus
Learn to Trade
Never Miss A Trade Again

Signal Notification
Real-time signal notifications whenever a signal is opened, closes or Updated

Get Alerts
Immediate alerts to your email and mobile phone.

Entry Price Levels
Entry price level for every signal Just choose one of our Top Brokers in the list above to get all this free.