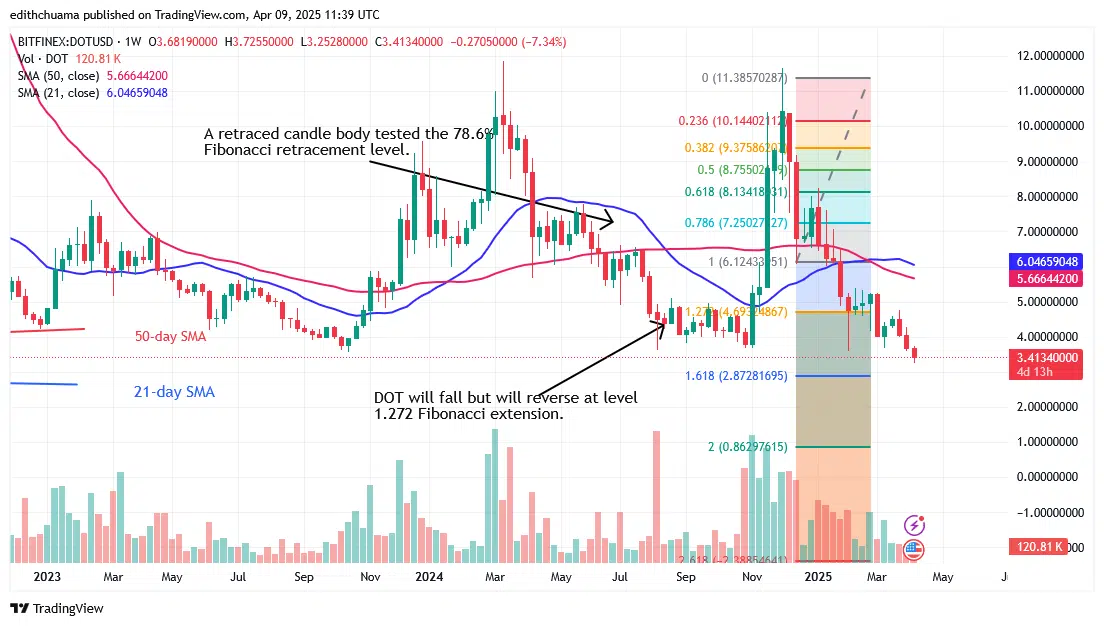
Polkadot (DOT) Price Long-term Trend: Bearish
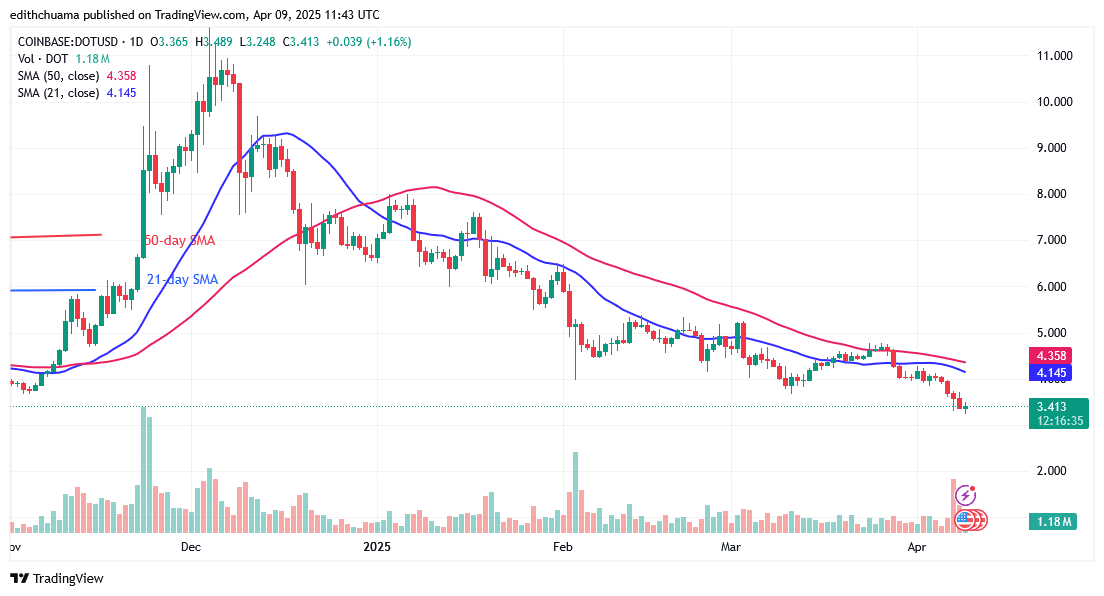
The price of Polkadot (DOT) is now above the bottom pricing point and steadily rises. The DOT price fell to its lowest point of $3.30 on April 7. During the most recent market action, Polkdot moved above the $3.80 support but below the moving average lines and the $4.80 resistance.The decline was caused by the bulls’ inability to establish a bullish trend above the moving average lines.
The bears have broken both the moving average lines and the present support in order to reach the low of $3.30. Polkadot is now at the bottom of the chart The oversold area of the market has been reached. The DOT price as of this writing is $3.41.
Technical indicators:
Key Resistance Levels: $10, $12, $14
Key Support Levels: $5, $3, $1
Polkadot Indicator Analysis
The moving average lines on the daily chart have a southward slope. On the weekly chart, however, the moving average lines are horizontal. The price bars on both charts show the present downward trend because they are below the moving average lines. The presence of Doji candlesticks is causing the price of DOT to move slowly.
General Outlook for Polkadot (DOT)
Polkadot drops to a $3.30 low and steadily rises. On the downside, the DOT price will move above the $3.30 but below the $4.00 high if the $3.30 support holds. The altcoin is now in the market’s oversold area. On the downside, buyers will emerge to push prices upward.
Make money without lifting your fingers: Start using a world-class auto trading solution.
Note: Learn2.Trade is not a financial advisor. Do your research before investing your funds in any financial asset or presented product or event. We are not responsible for your investment
- Broker
- Min Deposit
- Score
- Visit Broker

- Award-winning Cryptocurrency trading platform
- $100 minimum deposit,
- FCA & Cysec regulated

- 20% welcome bonus of upto $10,000
- Minimum deposit $100
- Verify your account before the bonus is credited
- Fund Moneta Markets account with a minimum of $250
- Opt in using the form to claim your 50% deposit bonus
Learn to Trade
Never Miss A Trade Again

Signal Notification
Real-time signal notifications whenever a signal is opened, closes or Updated

Get Alerts
Immediate alerts to your email and mobile phone.

Entry Price Levels
Entry price level for every signal Just choose one of our Top Brokers in the list above to get all this free.