Key Resistance Levels: $10, $12,
Key Support Levels: $8, $6,$4
Polkadot (DOT) Price Long-term Trend: Bearish
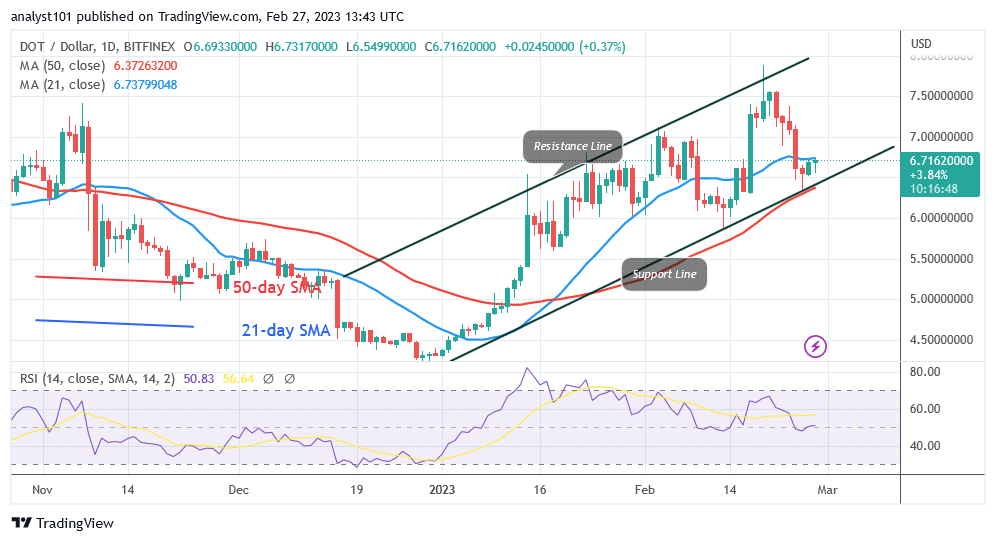
Polkadot (DOT) is in a downtrend as it risks rejection at $6.80. The DOT price is currently increasing as it gets closer to the 21-day line SMA. The cryptocurrency’s price is higher than the 50-day SMA but lower than the 21-day SMA. The DOT price varies greatly among the moving average lines. Most likely, the altcoin will have to move in a range between the moving average lines. If the 21-day line SMA is crossed, the market will rise to a high of $7.50. Similarly, if the cryptocurrency price breaks through the 50-day SMA, the downtrend will continue. Polkadot will test the previous lows at $6 and $5.50.
Daily Chart Indicators Reading:
The equilibrium price for Polkadot has been reached at level 51 of the Relative Strength Index for period 14. It suggests that the forces of supply and demand are in equilibrium. The price bars are currently within the moving average line, which allows the altcoin to rise.
Polkadot (DOT) Medium-term Trend: Bearish
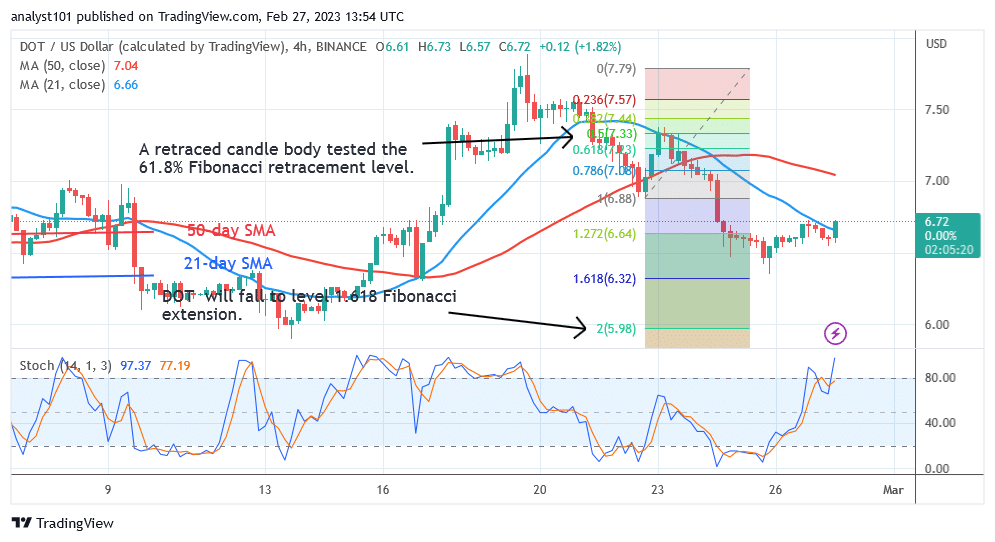
The price of the DOT is falling on the 4-hour chart. The crypto has dropped to a low of $6.42 after breaking below the moving average lines. The coin is probably going to lose more value.
4-hour chart Chart Indicators Reading
The market for the altcoin has become overbought. It is above the daily Stochastic level of 80. Prices will drop as sellers enter the market. The moving average lines have crossed in a bearish fashion. The 50-day line SMA and the 21-day line SMA cross below each other.
General Outlook for Polkadot (DOT)
Polkadot is moving upward as it risks rejection at $6.80. According to the Fibonacci tool, it will continue to fall until it reaches its previous low. It costs $5.98 at level 2.0 of the Fibonacci Extension.
You can purchase crypto coins here. Buy LBLOCK
Note: Learn2.Trade is not a financial advisor. Do your research before investing your funds in any financial asset or presented product or event. We are not responsible for your investing
- Broker
- Min Deposit
- Score
- Visit Broker

- Award-winning Cryptocurrency trading platform
- $100 minimum deposit,
- FCA & Cysec regulated

- 20% welcome bonus of upto $10,000
- Minimum deposit $100
- Verify your account before the bonus is credited
- Fund Moneta Markets account with a minimum of $250
- Opt in using the form to claim your 50% deposit bonus
Learn to Trade
Never Miss A Trade Again

Signal Notification
Real-time signal notifications whenever a signal is opened, closes or Updated

Get Alerts
Immediate alerts to your email and mobile phone.

Entry Price Levels
Entry price level for every signal Just choose one of our Top Brokers in the list above to get all this free.