Key Resistance Levels: $10, $12,$14
Key Support Levels: $5, $3,$1
Polkadot (DOT) Price Long-term Trend: Bullish
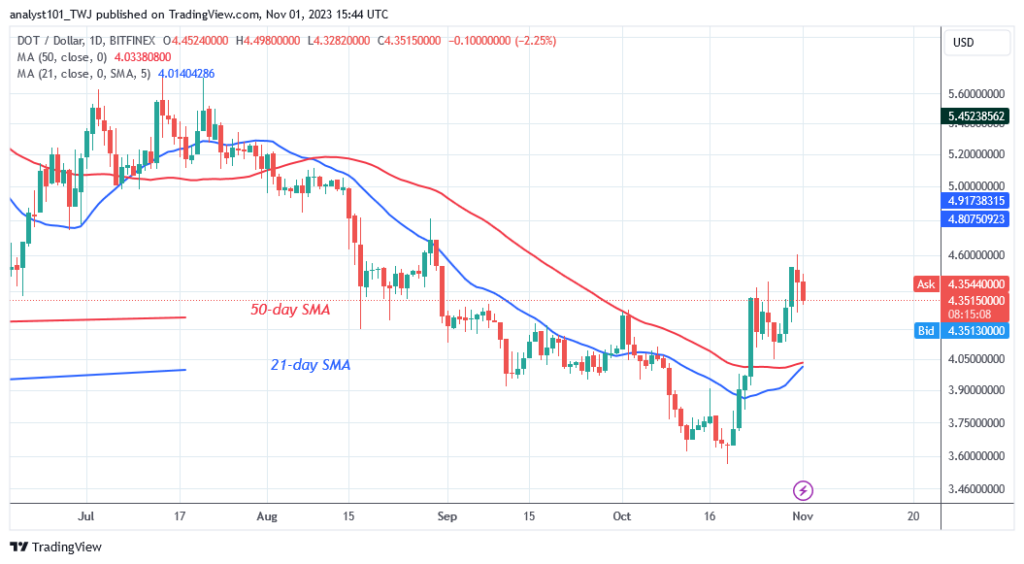
Polkadot (DOT) has maintained its upward trend, remaining above the $4.40 support level as it challenges the $4.80 high. The rise has been halted twice above the $4.80 resistance. If the current positive momentum continues, the current uptrend is anticipated to hit a high of $5.00.
Polkadot faces a drop if it fails to rise beyond its previous high. The altcoin fell to a low of $3.56 in the previous rejection as bulls purchased the dips. The cryptocurrency has risen above the moving average lines.
On the downside, if the latest high is rejected, the altcoin will fall above the $4.20 support. DOT/USD is currently trading at $4.78 at the time of writing.
Daily Chart Indicators Reading:
The price bars are above the moving average lines as they reach higher highs and lower lows. The moving average lines in the lower period are pointing northward, indicating an uptrend. The 21-day SMA serves as the price bars’ resistance bar.
General Outlook for Polkadot (DOT)
Polkadot is about to rise to new highs as it challenges the $4.80 high.
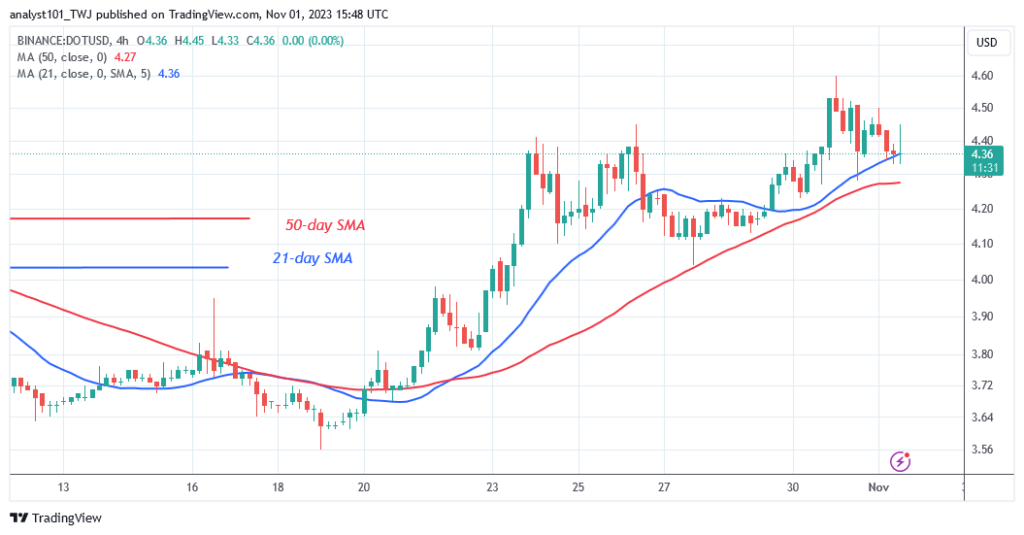
The breaching of the resistance level will indicate the start of the rising momentum again. The price rebound was considerable on November 1st, but it has yet to break through the barrier at the previous high.
The altcoin may start a sideways trend above the moving average lines if it faces rejection at the recent high.
You can purchase crypto coins here. Buy LBLOCK
Note: Learn2.Trade is not a financial advisor. Do your research before investing your funds in any financial asset or presented product or event. We are not responsible for your investing
- Broker
- Min Deposit
- Score
- Visit Broker

- Award-winning Cryptocurrency trading platform
- $100 minimum deposit,
- FCA & Cysec regulated

- 20% welcome bonus of upto $10,000
- Minimum deposit $100
- Verify your account before the bonus is credited
- Fund Moneta Markets account with a minimum of $250
- Opt in using the form to claim your 50% deposit bonus
Learn to Trade
Never Miss A Trade Again

Signal Notification
Real-time signal notifications whenever a signal is opened, closes or Updated

Get Alerts
Immediate alerts to your email and mobile phone.

Entry Price Levels
Entry price level for every signal Just choose one of our Top Brokers in the list above to get all this free.