Key Resistance Levels: $60, $62, $64
Key Support Levels: $40, $38,$36
Polkadot (DOT) Price Long-term Trend: Bearish
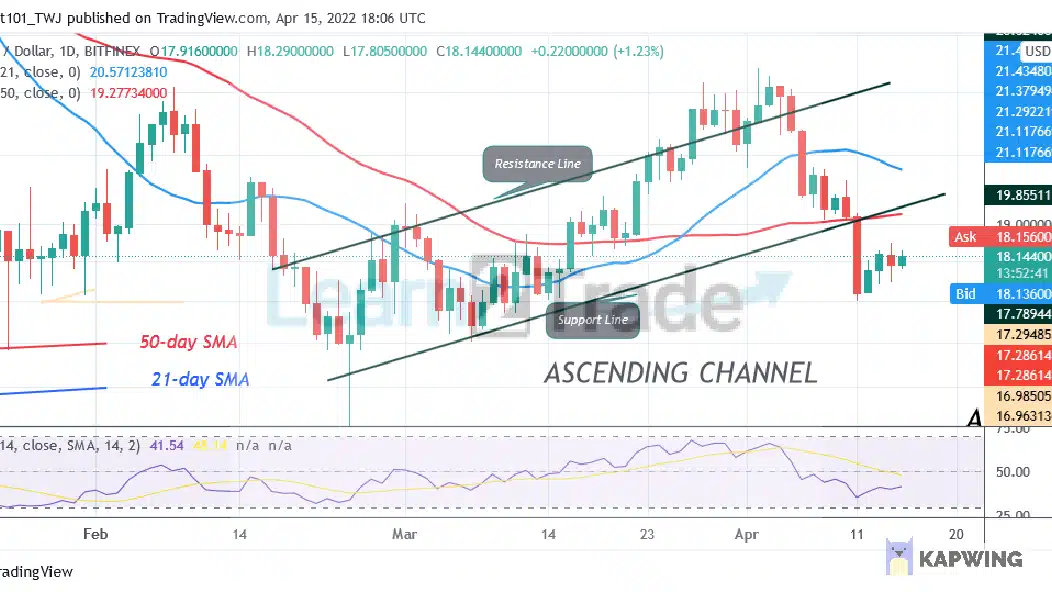
Polkadot’s (DOT) price is in a downward correction as the altcoin reaches the overbought region. The altcoin is making an upward correction as the market reaches the high of $18.28. Buyers have an uphill task as they face the resistance at $19. The bulls have to break above the moving averages to resume an uptrend. However, if the bulls fail to break the recent high, the market will decline to the previous low at $17. A break below the $17 support will propel the altcoin to decline to the $14 low. Today, Polkadot is trading and approaching the resistance at $19.
Daily Chart Indicators Reading:
The crypto has fallen to level 42 of the Relative Strength Index for period 14. The altcoin is in the downtrend zone and capable of falling to the downside. The crypto’s price is below the moving averages which indicates a possible decline of the altcoin. The crypto is above the 80% range of the daily stochastic. Polkadot has reached the overbought region of the market.
Polkadot (DOT) Medium-term Trend: Bearish
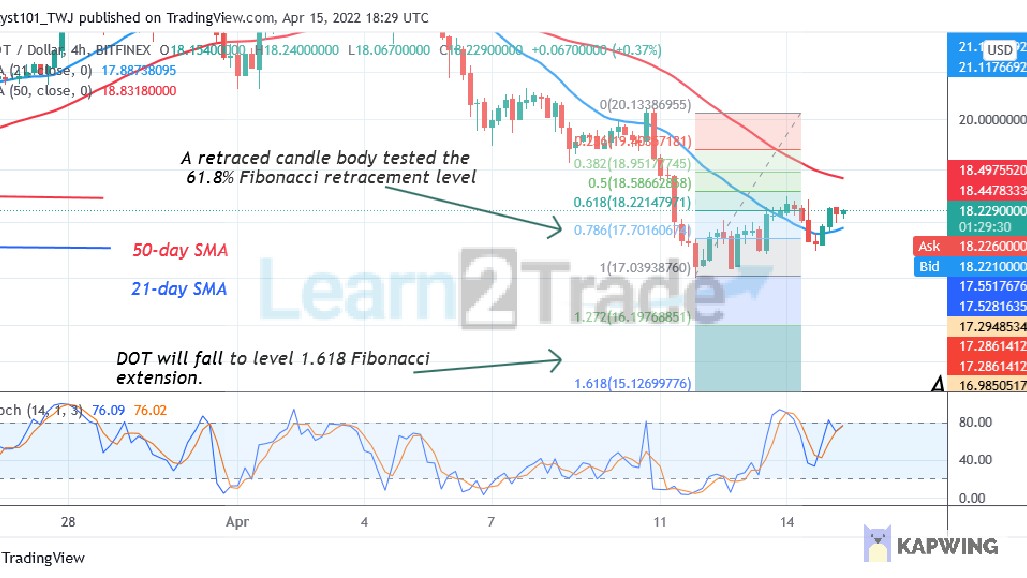
Polkadot is in a downward move as price reaches the $17 support. The altcoin is correcting upward as price breaks above the 21-day line moving average. Meanwhile, on April 11 downtrend; a retraced candle body tested the 61.8% Fibonacci retracement level. The retracement indicates that DOT will fall to level 1.618 Fibonacci extension or $15.12.
4-hour Chart Indicators Reading
DOT price is above the 80% range of the daily stochastic. The market has reached the overbought region. The 50-day line SMA and the 21-day line SMA are sloping downward indicating the downtrend.
General Outlook for Polkadot (DOT)
Polkadot is still in a downward correction as altcoin reaches the overbought region. The downward correction will resume if price faces rejection at the recent high. Nonetheless, the uptrend will resume if price breaks above the moving averages.
You can purchase crypto coins here: Buy LBlock
Note: Learn2Trade.com is not a financial advisor. Do your research before investing your funds in any financial asset or presented product or event. We are not responsible for your investing results
- Broker
- Min Deposit
- Score
- Visit Broker

- Award-winning Cryptocurrency trading platform
- $100 minimum deposit,
- FCA & Cysec regulated

- 20% welcome bonus of upto $10,000
- Minimum deposit $100
- Verify your account before the bonus is credited
- Fund Moneta Markets account with a minimum of $250
- Opt in using the form to claim your 50% deposit bonus
Learn to Trade
Never Miss A Trade Again

Signal Notification
Real-time signal notifications whenever a signal is opened, closes or Updated

Get Alerts
Immediate alerts to your email and mobile phone.

Entry Price Levels
Entry price level for every signal Just choose one of our Top Brokers in the list above to get all this free.