Key Resistance Levels: $60, $62, $64
Key Support Levels: $40,$38,$36
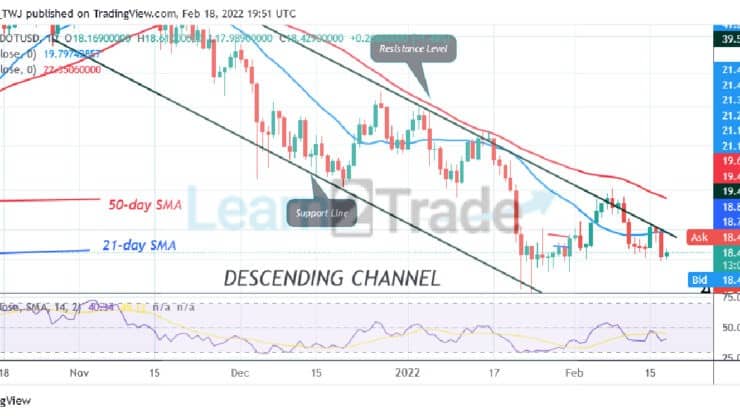
Polkadot (DOT) Price Long-term Trend: Bearish
Polkadot’s (DOT) price has fallen below the moving averages but may revisit the $16 low. The altcoin has resumed a downward correction between the levels of $16 and $20. In the previous price action, buyers could not break the resistance at $23 and the 50-line moving average. Consequently, the downtrend resumed. After the recent price slump, DOT/USD is trading at $18.42 as of press time. Nevertheless, if the DOT price rebounds above the current support, the resistance levels of $20 and $23 are likely to be broken. The altcoin will rally above the moving averages which will compel the altcoin to resume upside momentum. Nonetheless, the downward correction will continue where the bullish scenario is invalidated.
Daily Chart Indicators Reading:
The cryptocurrency is below the moving averages indicating a possible downward move. The crypto is at level 40 of the Relative Strength Index for period 14. The altcoin is trading in the bearish trend zone and below the centerline 50. It is above the 25% area of the daily stochastic. The market is in the bullish momentum.
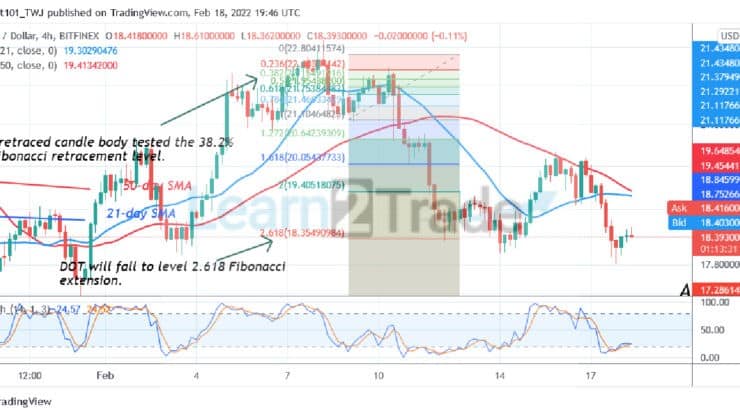
Polkadot (DOT) Medium-term Trend: Bearish
Polkadot has been declining after the rejection at the $23 high. Meanwhile, on February 8 downtrend; a retraced candle body tested the 38.2% Fibonacci retracement level. The retracement suggests that DOT will fall to level 2.618 Fibonacci extension or $18.35. From the price action, DOT is consolidating above the 2.618 Fibonacci extension.
4-hour Chart Indicators Reading
DOT price is above the 25% area of the daily stochastic. The altcoin is in bullish momentum. The 21-day SMA and the 50-day SMA are sloping downward indicating the downtrend.
General Outlook for Polkadot (DOT)
DOT/USD is in downward correction but may revisit the $16 low. The downtrend has eased as the altcoin fell to the oversold region of the market. Buyers will emerge in the oversold region to push the altcoin upward.
You can purchase crypto coins here: Buy Coins
Note: Learn2Trade.com is not a financial advisor. Do your research before investing your funds in any financial asset or presented product or event. We are not responsible for your investing results
- Broker
- Min Deposit
- Score
- Visit Broker

- Award-winning Cryptocurrency trading platform
- $100 minimum deposit,
- FCA & Cysec regulated

- 20% welcome bonus of upto $10,000
- Minimum deposit $100
- Verify your account before the bonus is credited
- Fund Moneta Markets account with a minimum of $250
- Opt in using the form to claim your 50% deposit bonus
Learn to Trade
Never Miss A Trade Again

Signal Notification
Real-time signal notifications whenever a signal is opened, closes or Updated

Get Alerts
Immediate alerts to your email and mobile phone.

Entry Price Levels
Entry price level for every signal Just choose one of our Top Brokers in the list above to get all this free.