Resistance Levels: $60, $62, $64
Key Support Levels: $40, $38,$36
Polkadot (DOT) Price Long-term Trend: Bearish
Polkadot’s (DOT) price is in a downward correction as it targets the $14 high. The bulls have broken above the initial resistance at $10 but the price is moving marginally to the upside. The altcoin has recovered from the current downtrend as price breaks above the initial resistance.DOT price is expected to rally to $14 high if the current bullish momentum is sustained. Nevertheless, if the DOT price turns from the recent high and breaks below the $10 price level, the altcoin will be compelled to range-bound move between $7.18 and $10.00 price levels. In the meantime, Polkadot is rising to the upside.
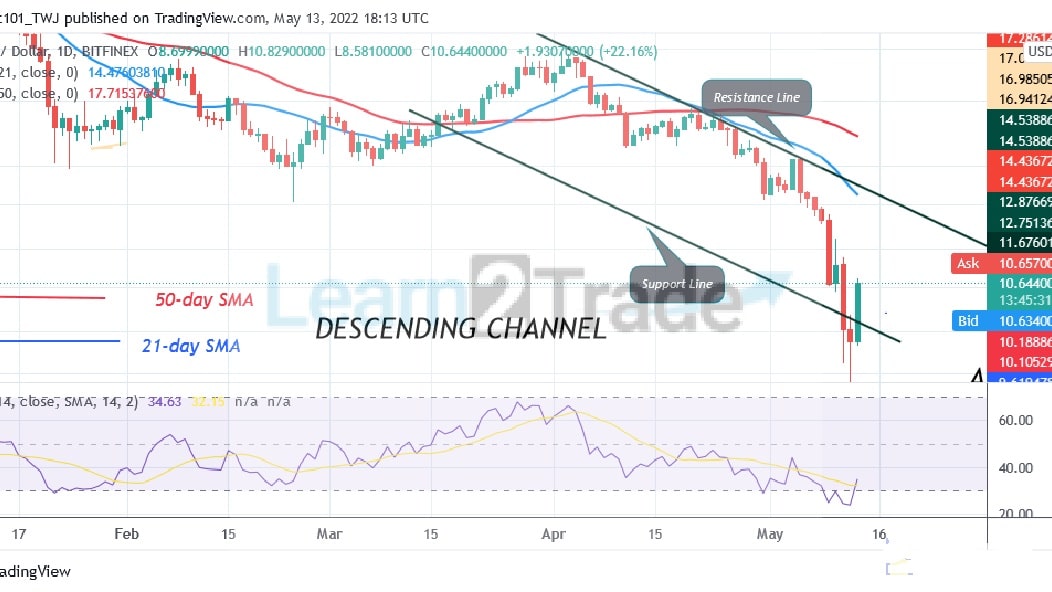
Daily Chart Indicators Reading:
DOT is in an uptrend as it rises to level 37 of the Relative Strength Index for period 14. The altcoin is in the downtrend zone but approaches the bullish trend zone. The crypto’s price bars are below the moving averages which makes the altcoin prone to fall.
Polkadot (DOT) Medium-term Trend: Bullish
DOT/USD is in an uptrend as the price breaks above the moving averages. The uptrend is facing rejection in the overbought region. Meanwhile, on May 12 uptrend; a retraced candle body tested the 50% Fibonacci retracement level. The retracement suggests that DOT price will rise to level 2.0 Fibonacci extension or level $11.65.
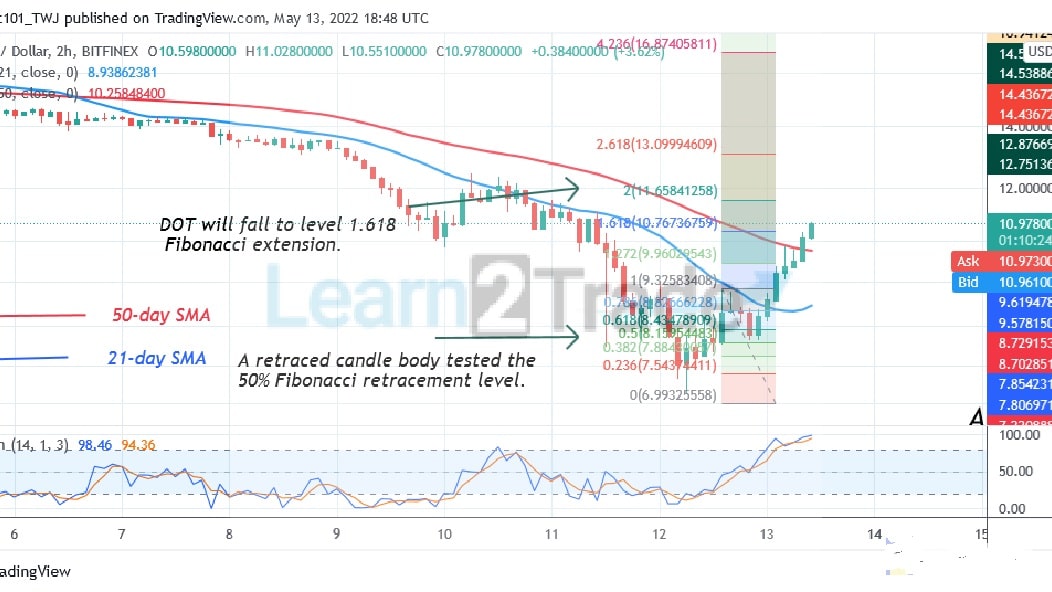
2-hour chart Chart Indicators Reading
The 21-day line SMA and 50-day line SMA are sloping upward indicating the uptrend. DOT’s price is above the 80% range of the daily stochastic. It indicates that the market has reached the overbought region. Also, it implies that the current uptrend may face rejection in the overbought region.
General Outlook for Polkadot (DOT)
DOT/USD has resumed bullish momentum as it targets the $14 high. The current uptrend is hovering above the $11 support.
You can purchase crypto coins here. Buy LBlock
Note: Learn2.Trade is not a financial advisor. Do your research before investing your funds in any financial asset or presented product or event. We are not responsible for your investing
- Broker
- Min Deposit
- Score
- Visit Broker

- Award-winning Cryptocurrency trading platform
- $100 minimum deposit,
- FCA & Cysec regulated

- 20% welcome bonus of upto $10,000
- Minimum deposit $100
- Verify your account before the bonus is credited
- Fund Moneta Markets account with a minimum of $250
- Opt in using the form to claim your 50% deposit bonus
Learn to Trade
Never Miss A Trade Again

Signal Notification
Real-time signal notifications whenever a signal is opened, closes or Updated

Get Alerts
Immediate alerts to your email and mobile phone.

Entry Price Levels
Entry price level for every signal Just choose one of our Top Brokers in the list above to get all this free.