Technical indicators:
Major Resistance Levels – $10, $12, $14
Major Support Levels – $8, $6, $4
DOT/USD Long-term Trend: Bearish
Polkadot’s (DOT) price is in a downtrend as it hovers above $7.00 support. After the decline, buyers pushed the coin to the 50-day line SMA but were repelled. The cryptocurrency will further decline above the $7.03 support. On the August 20 price slump, Polkadot declined and found support above the $7.04 support. For the past week, the altcoin has been fluctuating above the current support but below the 50-day line SMA. On the upside, if the bulls break above the moving average lines, the altcoin will rise and revisit the $9.68 overhead resistance. Polkadot will further decline if the current support is breached. This implies that the crypto will further decline to the previous lows at $6.52 and $5.98 price levels.
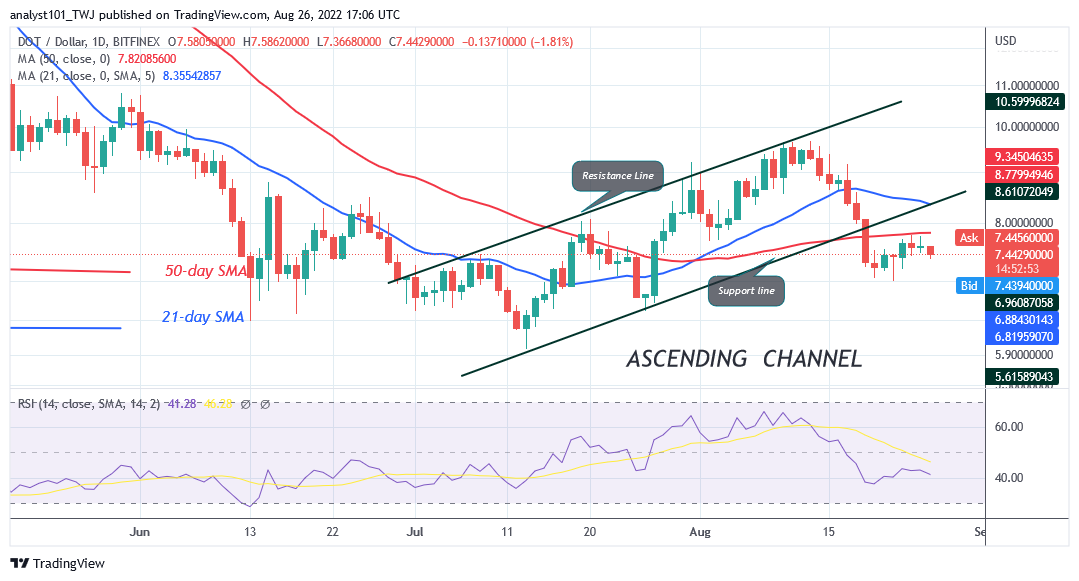
Daily Chart Indicators Reading:
The altcoin is at level 41 of the Relative Strength Index for period 14. DOT price is in a downtrend trend zone and may further decline. The price bars are still fluctuating below the moving average lines which will lead to further decline.
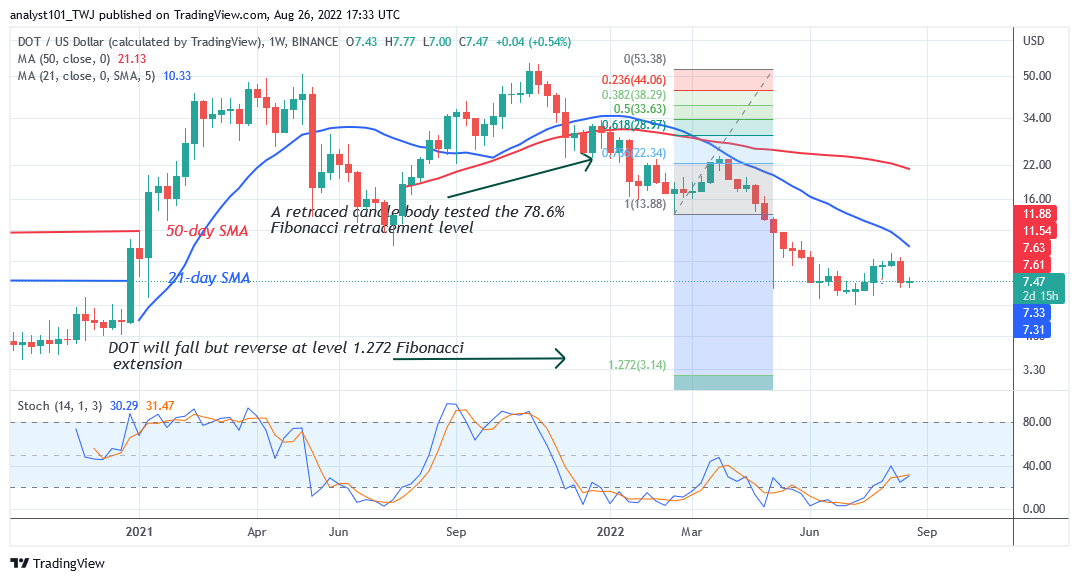
DOT/USD Medium-term bias: Bearish
On a weekly chart, the DOT price has fallen significantly to the downside. Today, the market is declining again after facing rejection at the 21-day line SMA. On a weekly chart, a retraced candle body tested the 78.6% Fibonacci retrenchment. The retracement suggests that DOT/USD will fall to level 1.272 Fibonacci extension or level $3.14. From the price action, the DOT price has fallen to the low of $7.47.
4-hour Chart Indicators Reading
DOT price is below the 40% range of the daily stochastic. The market is in a bearish momentum. The 21-day line and 50-day line moving averages are sloping southward indicating the downtrend.
General Outlook for Polkadot
.
Polkadot is in a downward move as it hovers above $7.00 support. Presently, it is fluctuating above the current support. The altcoin will further decline to the low of $5.98.
You can purchase crypto coins here: Buy LBLOCK
Note: Learn2.Trade is not a financial advisor. Do your research before investing your funds in any financial asset or presented product or event. We are not responsible for your investing results
- Broker
- Min Deposit
- Score
- Visit Broker

- Award-winning Cryptocurrency trading platform
- $100 minimum deposit,
- FCA & Cysec regulated

- 20% welcome bonus of upto $10,000
- Minimum deposit $100
- Verify your account before the bonus is credited
- Fund Moneta Markets account with a minimum of $250
- Opt in using the form to claim your 50% deposit bonus
Learn to Trade
Never Miss A Trade Again

Signal Notification
Real-time signal notifications whenever a signal is opened, closes or Updated

Get Alerts
Immediate alerts to your email and mobile phone.

Entry Price Levels
Entry price level for every signal Just choose one of our Top Brokers in the list above to get all this free.