Key Resistance Levels: $10, $12,$14
Key Support Levels: $5, $3,$1
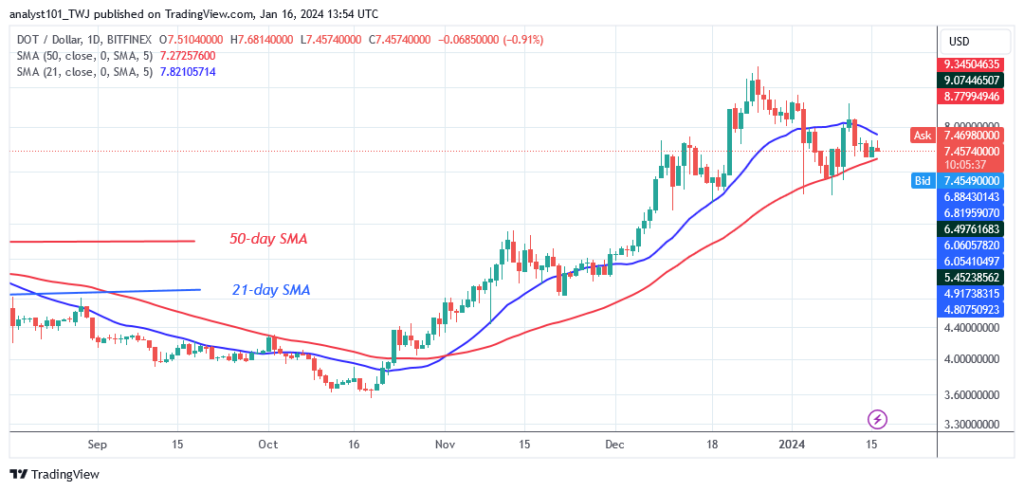
Polkadot (DOT) Price Long-term Trend: Bearish
Polkadot’s (DOT) price stays between the moving average lines as it reaches bearish weariness. On January 11, buyers sought to keep the price above the 21-day simple moving average but were met with resistance at $8.50.
In addition, the bears have retested the 50-day SMA three times without breaking down. Buyers are defending the 50-day SMA to the downside. The lengthy candlestick tails on January 3 imply significant buying above the 50-day SMA support.
Polkadot faces an additional drop due to its rejection at the peak of $8.50. The coin will drop to a low of $7.00 before reversing.
Daily Chart Indicators Reading:
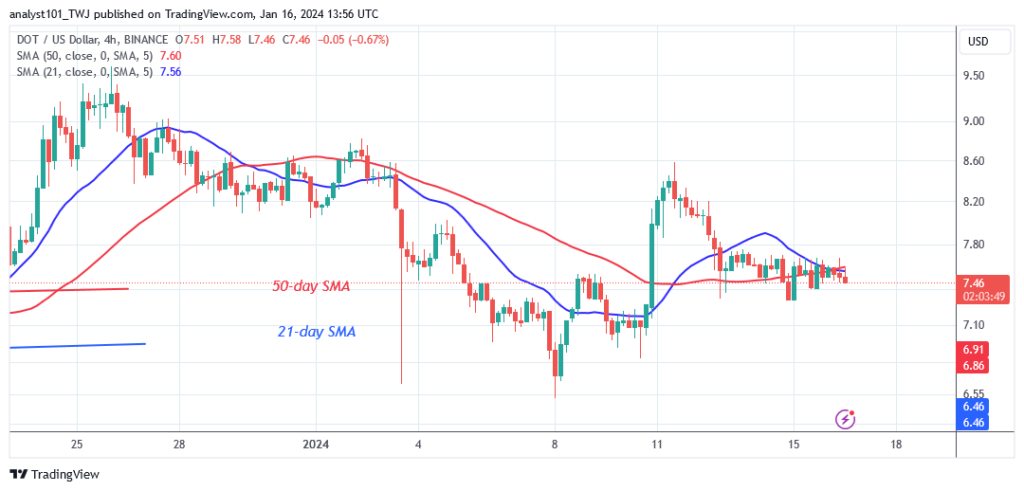
Since January 3, Polkadot has been trapped between the moving average lines. A range of fluctuations has been observed in the cryptocurrency in anticipation of a future trend. On the 4-hour chart, the moving average lines are sloping horizontally following two rejections at the $8.50 high.
General Outlook for Polkadot (DOT)
Polkadot consolidates above the $7.30 support as it reaches bearish weariness. The current price range is $6.70 to $8.50. The altcoin is declining as it approaches the current support. On the 4-hour chart, the price action is dominated by the Doji candlestick.
You can purchase crypto coins here. Buy LBLOCK
Note: Learn2.Trade is not a financial advisor. Do your research before investing your funds in any financial asset or presented product or event. We are not responsible for your investing
- Broker
- Min Deposit
- Score
- Visit Broker

- Award-winning Cryptocurrency trading platform
- $100 minimum deposit,
- FCA & Cysec regulated

- 20% welcome bonus of upto $10,000
- Minimum deposit $100
- Verify your account before the bonus is credited
- Fund Moneta Markets account with a minimum of $250
- Opt in using the form to claim your 50% deposit bonus
Learn to Trade
Never Miss A Trade Again

Signal Notification
Real-time signal notifications whenever a signal is opened, closes or Updated

Get Alerts
Immediate alerts to your email and mobile phone.

Entry Price Levels
Entry price level for every signal Just choose one of our Top Brokers in the list above to get all this free.