Key Resistance Levels: $60, $62, $64
Key Support Levels: $40, $38,$36
Polkadot (DOT) Price Long-term Trend: Bullish
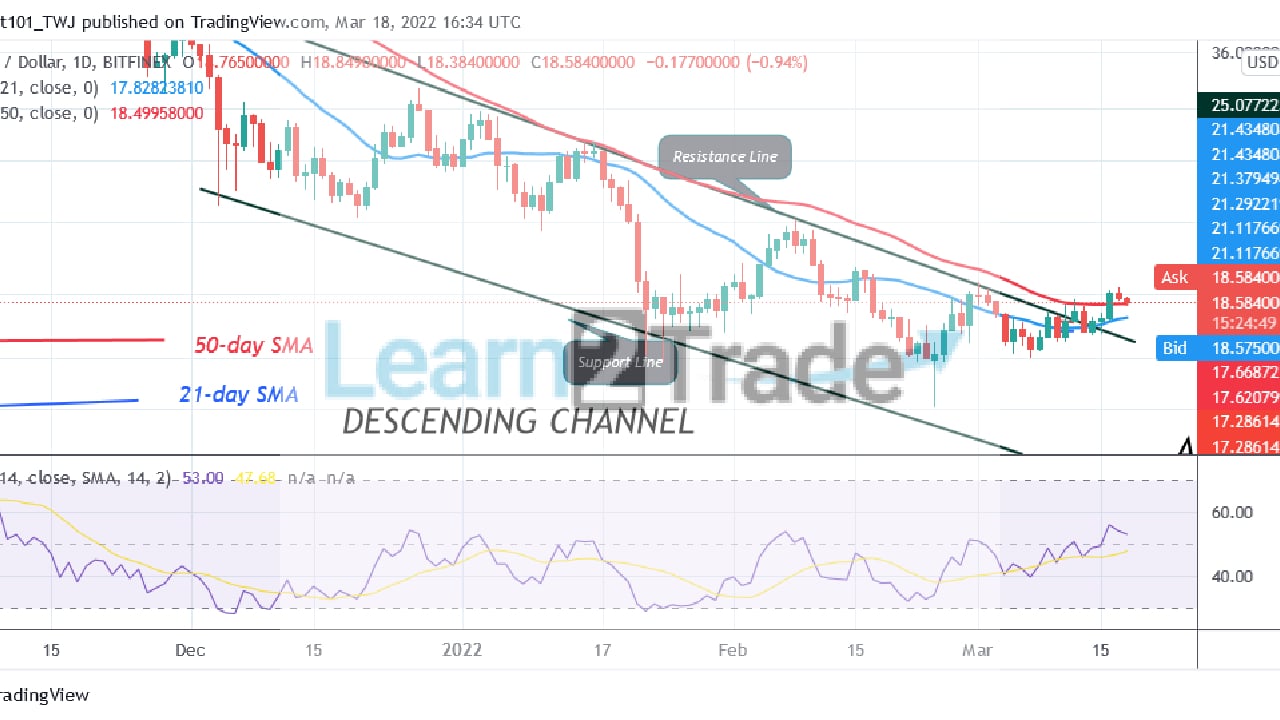
Today, Polkadot’s (DOT) price has broken above the moving averages as it poises to revisit the $19 high . Buyers failed to keep the price above the moving averages as sellers sold at each rally. Today, DOT price is falling and may fall below the moving averages. However, if the cryptocurrency holds above the moving averages, there is a tendency for the altcoin to retest the $19 resistance. A break above the recent high will push the crypto to the highs of $22 and $27 price levels. Conversely, if the bears break below the moving averages, the downward correction will resume as the altcoin revisits the previous low at $16.
Daily Chart Indicators Reading:
The crypto is at level 51 of the Relative Strength Index for period 14. It indicates that there is a balance between supply and demand. However, the altcoin risks further decline if price breaks below the downward correction. The crypto’s price bars are above the moving averages for a possible upward
Polkadot (DOT) Medium-term Trend: Bearish
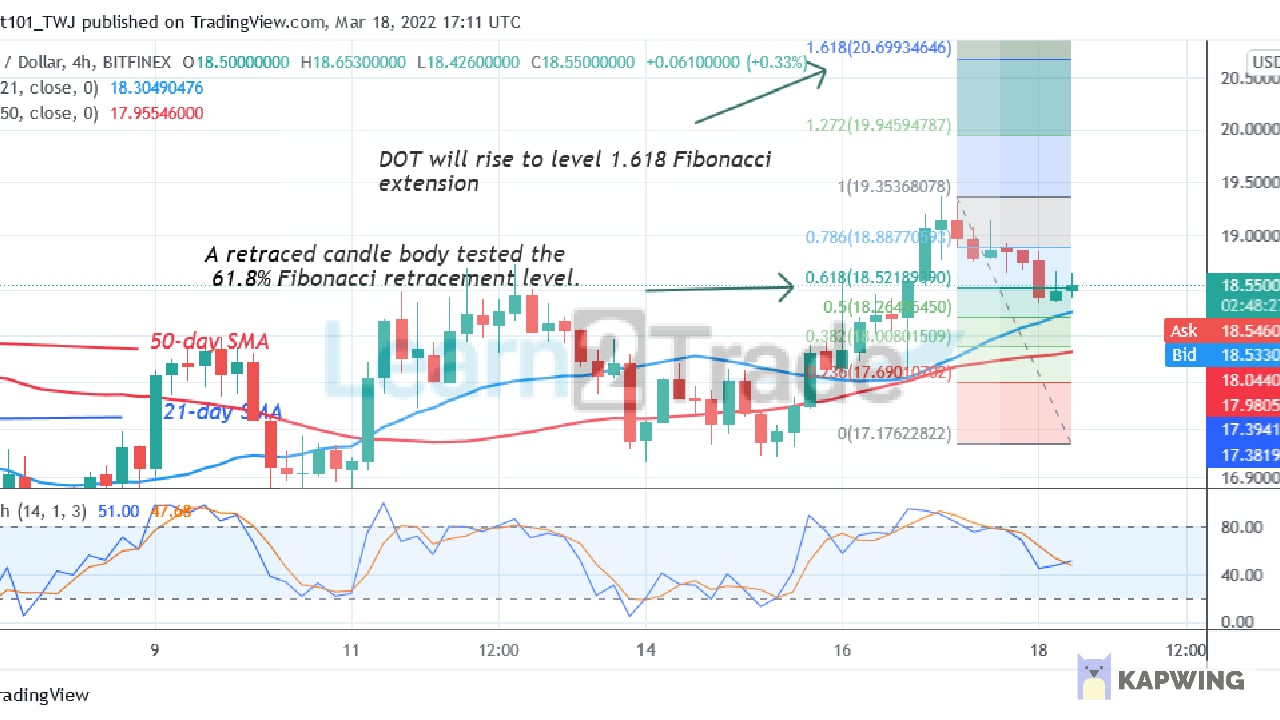
On the 4- hour chart, Polkadot is in an uptrend. The altcoin is retracing after a recent rejection. Meanwhile, on March 17 uptrend; a retraced candle body tested the 61.8% Fibonacci retracement level. The retracement suggests that DOT will rise to level 1.618 Fibonacci extension or level $20.69.
4-hour Chart Indicators Reading
DOT price is above the 40% range of the daily stochastic. The market has resumed bullish momentum. The 21-day SMA and the 50-day SMA are sloping upward indicating the uptrend.
General Outlook for Polkadot (DOT)
DOT/USD is still struggling to remain above the moving averages as it poises to revisit the $19 high. The current retracement has reached the oversold region. Buyers are likely to push the altcoin upward.
You can purchase crypto coins here: Buy LBlock
Note: Learn2Trade.com is not a financial advisor. Do your research before investing your funds in any financial asset or presented product or event. We are not responsible for your investing results
- Broker
- Min Deposit
- Score
- Visit Broker

- Award-winning Cryptocurrency trading platform
- $100 minimum deposit,
- FCA & Cysec regulated

- 20% welcome bonus of upto $10,000
- Minimum deposit $100
- Verify your account before the bonus is credited
- Fund Moneta Markets account with a minimum of $250
- Opt in using the form to claim your 50% deposit bonus
Learn to Trade
Never Miss A Trade Again

Signal Notification
Real-time signal notifications whenever a signal is opened, closes or Updated

Get Alerts
Immediate alerts to your email and mobile phone.

Entry Price Levels
Entry price level for every signal Just choose one of our Top Brokers in the list above to get all this free.