Key Resistance Levels: $60, $62, $64
Key Support Levels: $40,$38,$36
Polkadot (DOT) Price Long-term Trend: Bearish
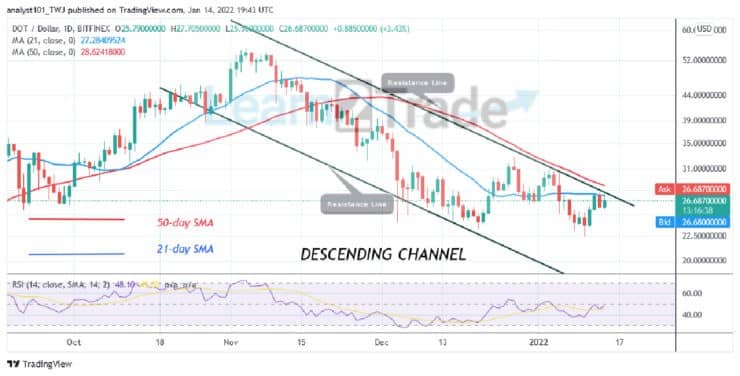
Polkadot’s (DOT) price is in a downward correction but targets level $30.41. The cryptocurrency makes a brief uptrend but gets stuck below the $28 resistance zone. For the past 48 hours, the bulls have been struggling to break above the $27 resistance level. DOT price has been compelled to fluctuate between $25 and $28 price levels. On the upside, if the bulls are successful, Polkadot will resume up trending. The market will rise to retest the next resistance at level $30. The bullish momentum will extend to the high of $55. However, if price retraces and breaks below the $25 support, Polkadot will revisit the previous low of $23.
Daily Chart Indicators Reading:
The altcoin is at level 50 of the Relative Strength Index for period 14. It indicates that there is a balance between supply and demand. The 21-day line moving average is acting as resistant to DOT price. The 21-day line and 50-day line moving averages are sloping southward indicating the downtrend.
Polkadot (DOT) Medium-term Trend: Bullish
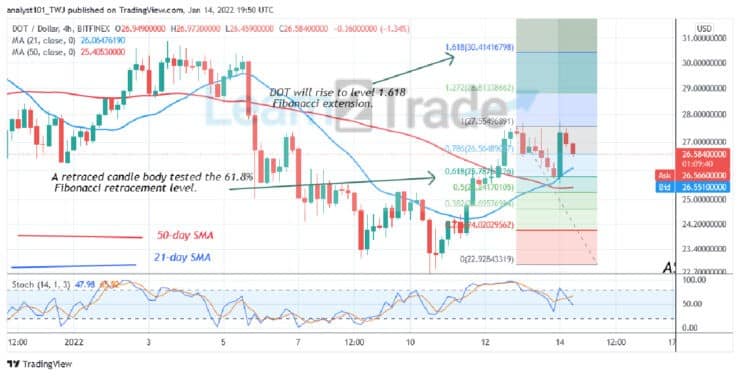
On the 4-hour chart, the DOT price is in an uptrend. The uptrend is hindered by the resistance at $27.Meanwhile, on January 12 uptrend; a retraced candle body tested the 61.8% Fibonacci retracement level. The retracement indicates that DOT price will rise to level 1.618 Fibonacci extensions or $30.41.
4-hour Chart Indicators Reading
Polkadot is below the 50% area of the daily stochastic. The market is in a bearish momentum. The 21-day SMA and the 50-day SMA are sloping upward indicating the uptrend.
General Outlook for Polkadot (DOT)
DOT/USD has regained bullish momentum as it targets level $30.41. According to the Fibonacci tool analysis, the market will rise to level $30 but will face initial resistance at the recent high.
You can purchase crypto coins here: Buy Coins
Note: Learn2Trade.com is not a financial advisor. Do your research before investing your funds in any financial asset or presented product or event. We are not responsible for your investing results
- Broker
- Min Deposit
- Score
- Visit Broker

- Award-winning Cryptocurrency trading platform
- $100 minimum deposit,
- FCA & Cysec regulated

- 20% welcome bonus of upto $10,000
- Minimum deposit $100
- Verify your account before the bonus is credited
- Fund Moneta Markets account with a minimum of $250
- Opt in using the form to claim your 50% deposit bonus
Learn to Trade
Never Miss A Trade Again

Signal Notification
Real-time signal notifications whenever a signal is opened, closes or Updated

Get Alerts
Immediate alerts to your email and mobile phone.

Entry Price Levels
Entry price level for every signal Just choose one of our Top Brokers in the list above to get all this free.