Key Resistance Levels: $60, $62, $64
Key Support Levels: $40,$38,$36
Polka dot (DOT) Price Long-term Trend: Bearish
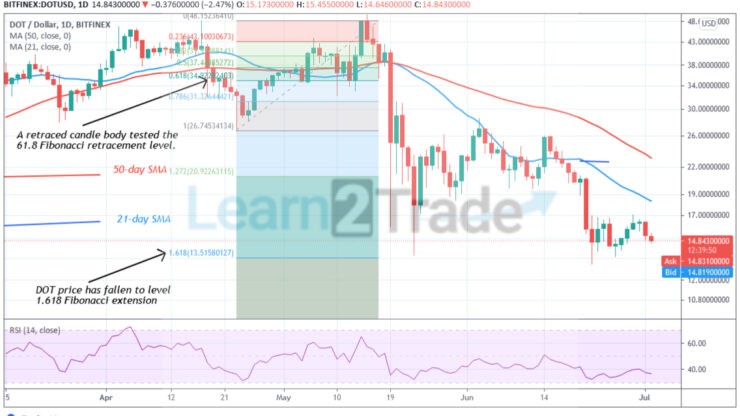
On June 22, Polkadot (DOT) fell to the previous low above $13. The bulls bought the dips to resume upward. For the past week, the DOT price has been fluctuating in a confined range between $13 and $17. The bulls have retested the resistance at $17 twice but were repelled. Consequently, the selling pressure has resumed as price approaches the lower price range. Meanwhile, on April 23 downtrend, a retraced candle body tested the 61.8 Fibonacci retracement level. The retracement indicates that DOT price will fall to level 1.618 Fibonacci extension or level $13.51. DOT price is failing and it is approaching the lower price range.
Daily Chart Indicators Reading:
Polkadot has fallen to level 36 of the Relative Strength Index period 14. It indicates that crypto is in the downtrend zone and below the centerline 50. The 21-day and the 50-day SMA are sloping southward indicating the downtrend.
Polkadot (DOT) Medium-term Trend: Bearish
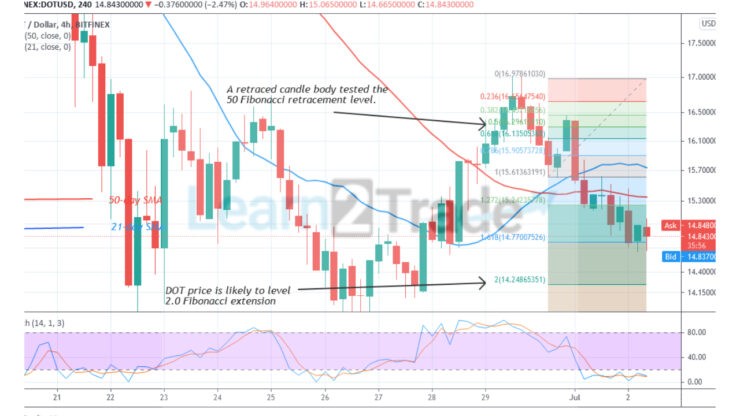
On the 4 hour chart, the altcoin is falling after rejection from the $17 high. The current downtrend is likely to reach the previous low at $13.70. On June 30 downtrend; a retraced candle body tested the 50% Fibonacci retracement level. The retracement indicates that DOT price will fall to level 2.0 Fibonacci extensions or level $14.24.
4-hour Chart Indicators Reading
Polkadot (DOT) is below the 20% range of the daily stochastic. It indicates that price has fallen to the oversold region. Buyers are expected to take control of prices. The 21-day SMA and the 50-day SMA are sloping downward indicating the downtrend.
General Outlook for Polkadot (DOT)
Polkadot’s (DOT) price is now revisiting the previous low at $13.73. The altcoin has also reached the overbought region of the market. Buyers are expected to emerge to push prices upward. According to the Fibonacci tool, DOT price will fall to level 2.0 Fibonacci extensions or level $14.24.
You can purchase crypto coins here. Buy Tokens
Note: Learn2Trade.com is not a financial advisor. Do your research before investing your funds in any financial asset or presented product or event. We are not responsible for your investing results
- Broker
- Min Deposit
- Score
- Visit Broker

- Award-winning Cryptocurrency trading platform
- $100 minimum deposit,
- FCA & Cysec regulated

- 20% welcome bonus of upto $10,000
- Minimum deposit $100
- Verify your account before the bonus is credited
- Fund Moneta Markets account with a minimum of $250
- Opt in using the form to claim your 50% deposit bonus
Learn to Trade
Never Miss A Trade Again

Signal Notification
Real-time signal notifications whenever a signal is opened, closes or Updated

Get Alerts
Immediate alerts to your email and mobile phone.

Entry Price Levels
Entry price level for every signal Just choose one of our Top Brokers in the list above to get all this free.