Don’t invest unless you’re prepared to lose all the money you invest. This is a high-risk investment and you are unlikely to be protected if something goes wrong. Take 2 minutes to learn more
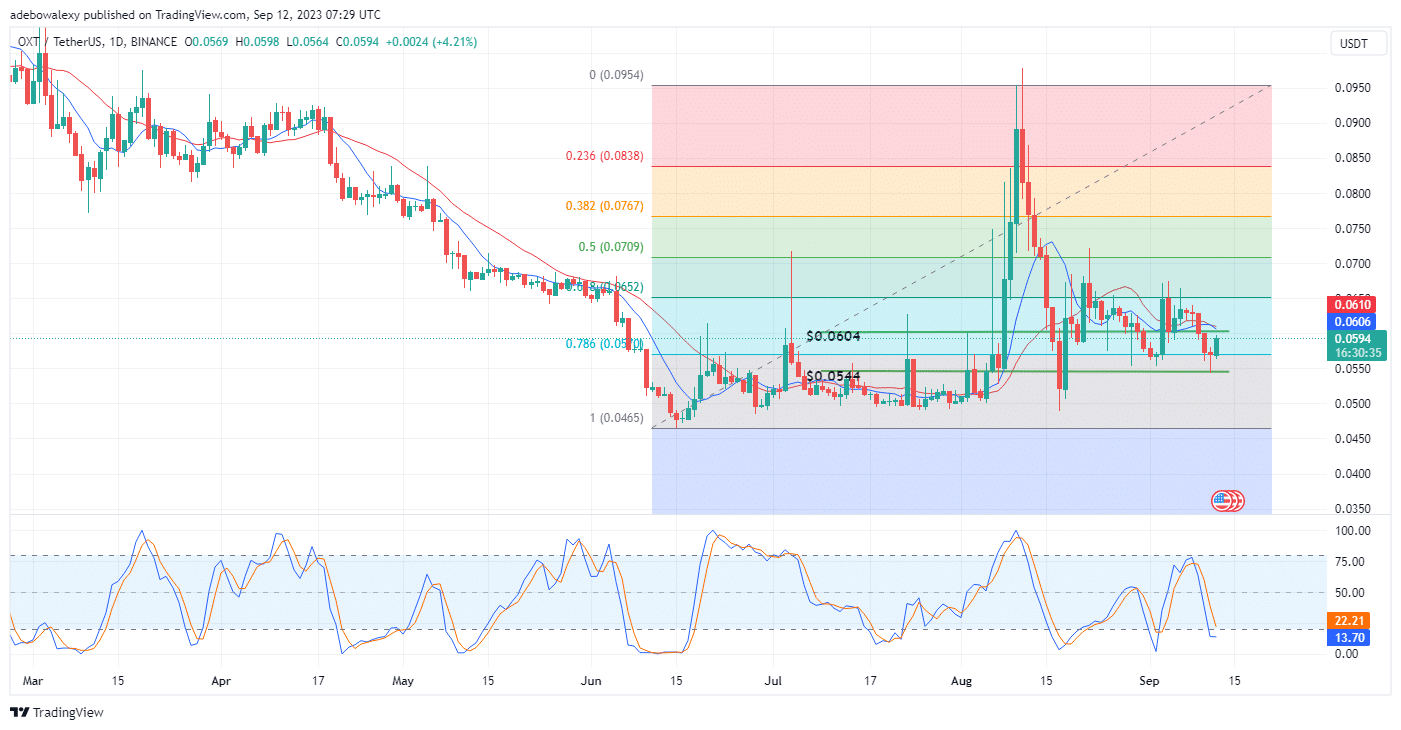
Orchid price action had earlier broken through the support level at the $0.0604 mark. However, it appears that buyers have mounted resistance to a further downward correction at the $0.0570 mark.
OXT Statistics:
Orchid Value Now: $0.0594
OXT Market Cap: $57,649,681
Orchid Circulating Supply: 962,629,339 OXT
OXT Total Supply: 1,000,000,000 OXT
Orchid CoinMarketCap Ranking: 309
Major Price Levels:
Top: $0.0594, $0.0630, and $0.0660
Base: $0.0550, $0.0500, and $0.0450

OXT Finds a Strong Footing at the $0.0570 Mark
Orchid price action is pointing out that buyers have resumed buying after price action fell through the $0.0604 mark. Also, the last price candle on this chart shows that the support mark at the $0.0570 mark may be very strong as price action has bounced off it for the second time.
Likewise, the Relative Strength Index (RSI) indicator’s leading line can now be seen correcting sharply sideways at this point. Nevertheless, trading activities continue to happen below the 9- and 21-day Smooth Moving Average SMA curves and at a critical point of a crossover. However, it appears that buyers may be strong enough to defy the resultant effect.

Orchid Stays Favored but Seems Rather Fragile
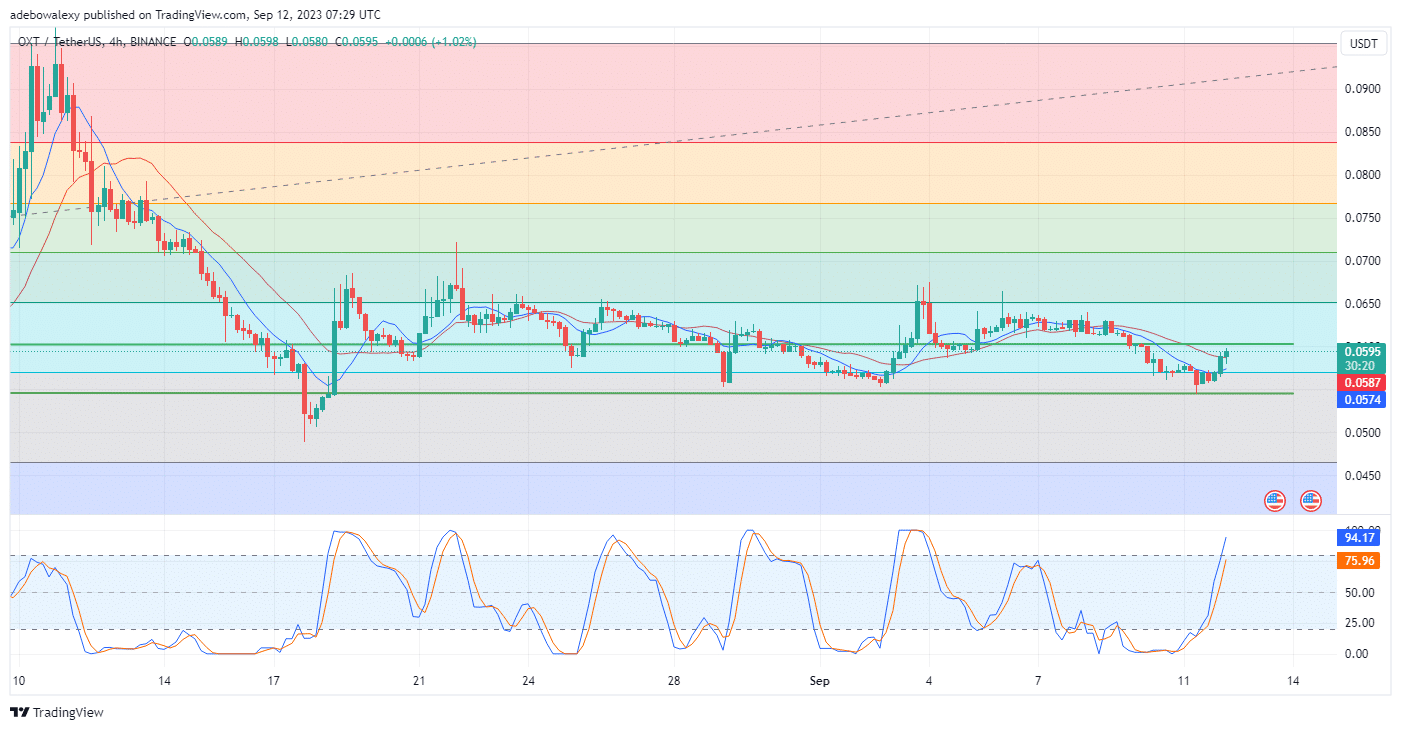
OXT generally takes a favorable stand against headwinds in the 4-hour market. The price candle for the ongoing session can be seen sitting just above the 21-day SMA curve as price action rises smoothly upwards. This has bullish implications for this token, as buyers may grow more confident.
However, the behavior of the RSI indicator may be raising the alarm that upside momentum may be burning too much fuel for very little price increase. This can be seen as the lines of this indicator have risen very deep into the overbought region at this point. This seems to warn traders that a downward correction may occur as soon as price action hits near the $0.0604 mark.
- Broker
- Min Deposit
- Score
- Visit Broker
- Award-winning Cryptocurrency trading platform
- $100 minimum deposit,
- FCA & Cysec regulated
- 20% welcome bonus of upto $10,000
- Minimum deposit $100
- Verify your account before the bonus is credited
- Fund Moneta Markets account with a minimum of $250
- Opt in using the form to claim your 50% deposit bonus
Learn to Trade
Never Miss A Trade Again

Signal Notification
Real-time signal notifications whenever a signal is opened, closes or Updated

Get Alerts
Immediate alerts to your email and mobile phone.

Entry Price Levels
Entry price level for every signal Just choose one of our Top Brokers in the list above to get all this free.


