Don’t invest unless you’re prepared to lose all the money you invest. This is a high-risk investment and you are unlikely to be protected if something goes wrong. Take 2 minutes to learn more
Prices in the Orchid market have risen far beyond expectations over just three trading sessions. Price behavior in this market suggests that buyers are rallying behind bullish opinions about this coin. This has created a massive tailwind, which has taken prices through multiple resistance levels.
OXT Statistics:
Orchid Value Now: $0.0874
Orchid Market Cap: $87,872,348
OXT Circulating Supply: 962,629,339
Orchid Total Supply: 1,000,000,000
OXT CoinMarketCap Ranking: 264
Major Price Levels:
Top: $0.0874, $0.0900, and $0.0950
Base: $0.0824, $0.0754, and $0.0704
Orchid Bulls Are on Rampage
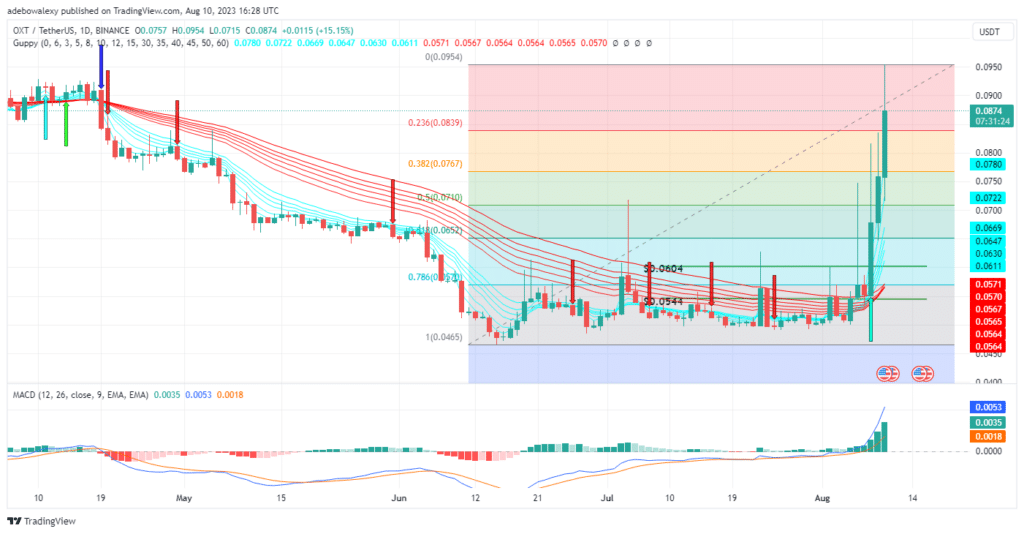
Price action binds the Orchid daily market and has maintained bullishness for three trading sessions. At this point, price action continues to march into the Bearish zone unchallenged. Additionally, trading indicators are still giving bullish indications about price movements in this market.
The last price candlestick on this chart has palace prices far above the Guppy Multiple Moving Average curves. Meanwhile, the Moving Average Convergence Divergence MACD indicator lines continue to rise steeply upward, with their histogram bars increasing in length very rapidly. As it stands, the upside momentum is strong and will likely keep pushing prices higher.
OXT Buyers Ain’t Backing Down
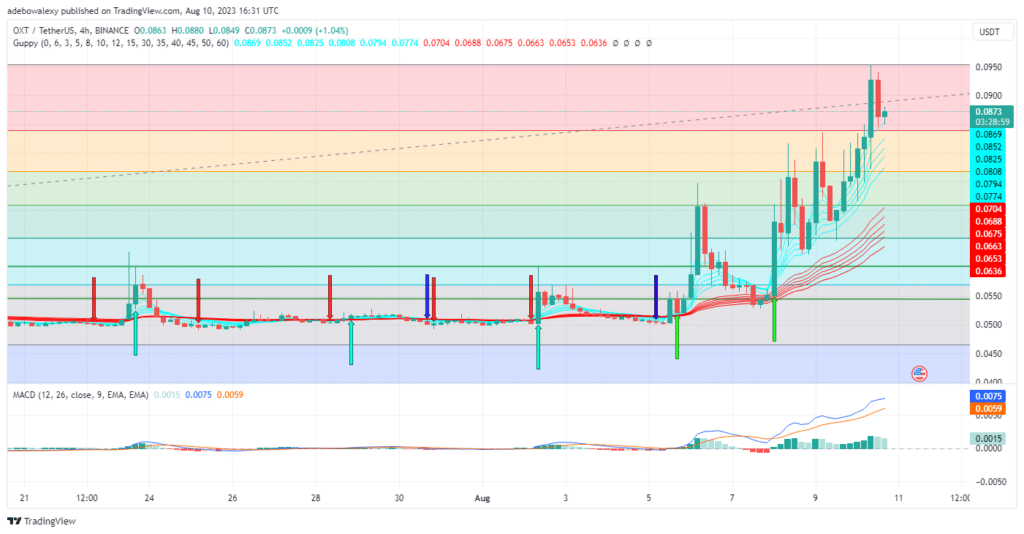
Meanwhile, the OXTUSDT 4-hour market is revealing that following a sustained price increase, a headwind has only introduced a moderate downward correction. However, the appearance of a green price candle on this chart shortly afterward seems to point out that buyers are still bullishly biased. Also, due to this, trading activities have continued to occur above the GMMA curves.
The lines of the MACD indicator are now above the equilibrium level and are still having an upside bearing. Nevertheless, the appearance of this indicator’s bars is now pale green. However, this is mostly due to the downside correction that occurred in this market. Therefore, traders can still anticipate further upside retracement towards the $0.0920 mark.
- Broker
- Min Deposit
- Score
- Visit Broker

- Award-winning Cryptocurrency trading platform
- $100 minimum deposit,
- FCA & Cysec regulated

- 20% welcome bonus of upto $10,000
- Minimum deposit $100
- Verify your account before the bonus is credited
- Fund Moneta Markets account with a minimum of $250
- Opt in using the form to claim your 50% deposit bonus
Learn to Trade
Never Miss A Trade Again

Signal Notification
Real-time signal notifications whenever a signal is opened, closes or Updated

Get Alerts
Immediate alerts to your email and mobile phone.

Entry Price Levels
Entry price level for every signal Just choose one of our Top Brokers in the list above to get all this free.