Don’t invest unless you’re prepared to lose all the money you invest. This is a high-risk investment and you are unlikely to be protected if something goes wrong. Take 2 minutes to learn more
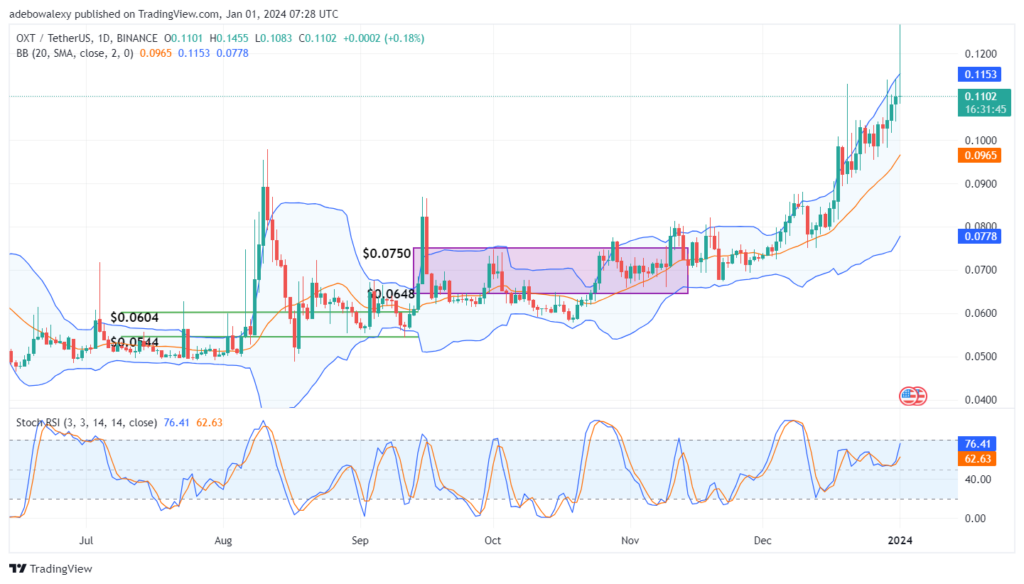
A sudden price surge has occurred in the OXT market, bringing the token to trade at a significant distance above the $0.1000 price level. However, a sudden decline of almost the same magnitude occurred in the following trading session (today’s), bringing the token back towards the $0.1100 mark. Nevertheless, trading indicators are still somewhat positive about this market. Let’s check it out.
Key OXT Statistics:
Current Orchid value: $0.1102
Orchid Market Cap: $110,552,652
OXT Circulating Supply: 979,379,108 OXT
OXT Total Supply: 1,000,000,000 OXT
Orchid CoinMarketCap Ranking: 338
Key Price Levels:
Resistance: $0.1102, $0.1200, and $0.1300
Support: $0.1100, $0.1000, and $0.0900

OXT Bulls Defends the $0.1100 Mark
As mentioned earlier, it can be seen that a significant price surge in the Orchid daily market was followed by a price decline of almost the same magnitude. However, it can be seen that further price declines were abated by buyers in the market, considering the appearance of the corresponding price candle for the ongoing session.
Buyers are managing to retain the lead, considering the appearance of the last green price candle on this chart. Interestingly, despite the activities in the market, the Stochastic Relative Strength Index (RSI) lines are maintaining their upside path. Consequently, this suggests that buyers are still going long.

Orchid Maintains a Favorable Stand
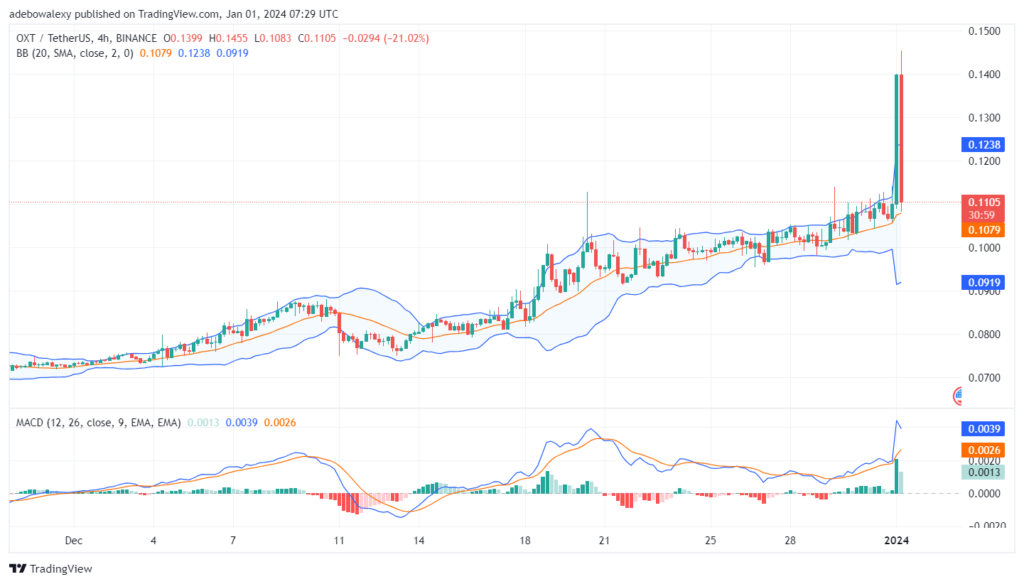
In the OXT 4-hour market, the nature of what happened has been portrayed. The ongoing session can be seen as a long red price candle, almost equaling the length of the corresponding price candle for the previous trading session. Nevertheless, the price candle remains above the middle band of the Bollinger Bands indicator line. Likewise, the MACD indicator lines are still above the equilibrium level.
Meanwhile, the leading lines of the indicator can be seen making a sharp bend downward. Also, the corresponding MACD bar for the ongoing session has remained above the equilibrium level but is now shorter and pale in appearance concerning bearish activities. Nevertheless, any bullish anticipation towards the $0.1200 mark should be done with proper risk planning in place.
Trade crypto coins on AvaTrade
- Broker
- Min Deposit
- Score
- Visit Broker
- Award-winning Cryptocurrency trading platform
- $100 minimum deposit,
- FCA & Cysec regulated
- 20% welcome bonus of upto $10,000
- Minimum deposit $100
- Verify your account before the bonus is credited
- Fund Moneta Markets account with a minimum of $250
- Opt in using the form to claim your 50% deposit bonus
Learn to Trade
Never Miss A Trade Again

Signal Notification
Real-time signal notifications whenever a signal is opened, closes or Updated

Get Alerts
Immediate alerts to your email and mobile phone.

Entry Price Levels
Entry price level for every signal Just choose one of our Top Brokers in the list above to get all this free.


