Don’t invest unless you’re prepared to lose all the money you invest. This is a high-risk investment and you are unlikely to be protected if something goes wrong. Take 2 minutes to learn more
Orchid’s price action is making a robust advance towards a medium-term resistance level. This resistance has remained unbroken since September 18th. However, bulls in the market are currently challenging this resistance after previous attempts to break through have failed. Let’s observe if this time will result in a successful breakthrough.
Key OXT Statistics:
Current Orchid Value: $0.0736
Orchid Market Cap: $69,863,172
Circulating Supply of OXT: 962,629,339
Total Supply of Orchid: 1,000,000,000
Orchid CoinMarketCap Ranking: 312
Key Price Levels:
Resistance: $0.0736, $0.0800, and $0.0850
Support: $0.0700, $0.0650, and $0.0600
 .0750 Price Level" width="580" height="304" data-lazy-src="https://learn2.trade/wp-content/uploads/2023/10/OXTUSDT_2023-10-25_11-59-23-1024x536.png"/>
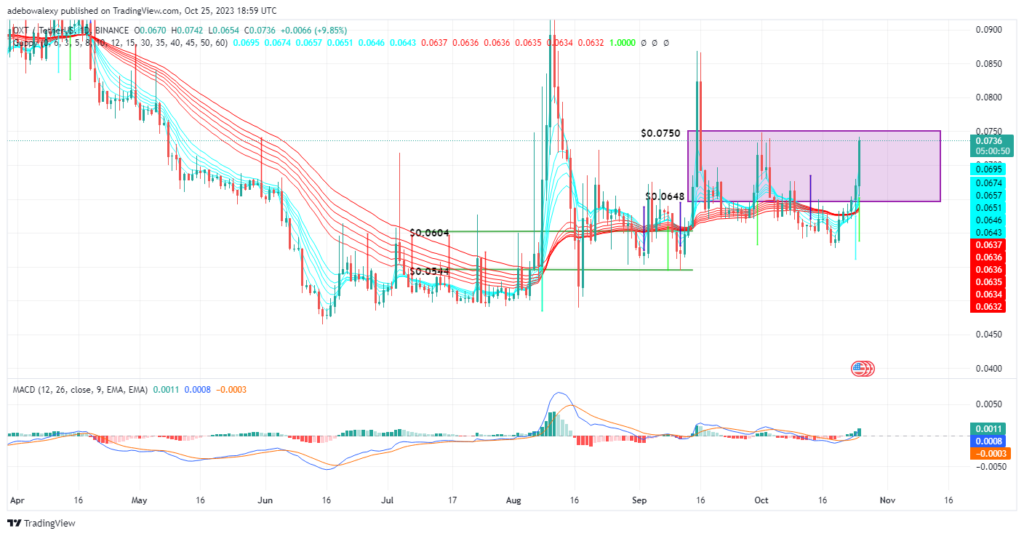
Today’s Trading Records Significant Profits in the Orchid Market
Price action in the Orchid daily market has shown remarkable gains today. As a result, it has pushed the token’s value above the $0.07300 price mark, getting closer to the medium-term resistance at $0.07500.
Furthermore, the current session is occurring above two sets of Guppy Multiple Moving Average curves, indicating that the upward momentum may continue to drive prices higher. Additionally, the Moving Average Convergence Divergence (MACD) indicator suggests a gradual increase in bullish momentum, reinforcing the possibility of prices advancing to higher levels.
.0750 Price Level" width="580" height="304" data-lazy-src="https://learn2.trade/wp-content/uploads/2023/10/OXTUSDT_2023-10-25_12-00-04-1024x536.png"/>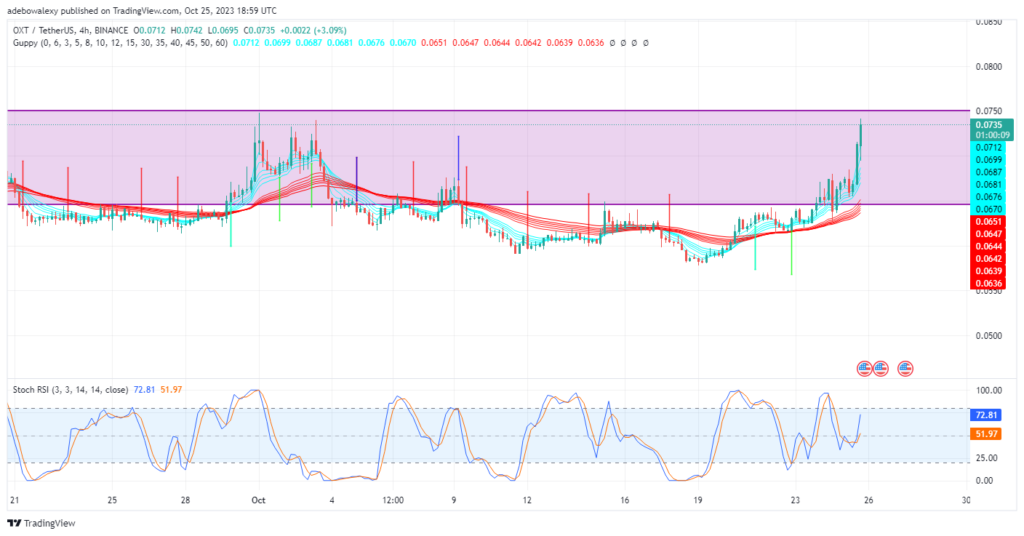
OXT Traders Maintain Long Positions
The ongoing session in the OXT 4-hour market demonstrates a substantial number of buyers actively participating. The length of the lower shadow signifies the buyers’ notable upward pressure. Simultaneously, the Stochastic Relative Strength Index (RSI) indicator displays a bullish crossover, with its lines rising sharply.
A considerable gap between the leading and lagging lines indicates strong market momentum. These indicators collectively suggest the potential for further upward movement, propelling prices above the $0.00800 mark.
- Broker
- Min Deposit
- Score
- Visit Broker

- Award-winning Cryptocurrency trading platform
- $100 minimum deposit,
- FCA & Cysec regulated

- 20% welcome bonus of upto $10,000
- Minimum deposit $100
- Verify your account before the bonus is credited
- Fund Moneta Markets account with a minimum of $250
- Opt in using the form to claim your 50% deposit bonus
Learn to Trade
Never Miss A Trade Again

Signal Notification
Real-time signal notifications whenever a signal is opened, closes or Updated

Get Alerts
Immediate alerts to your email and mobile phone.

Entry Price Levels
Entry price level for every signal Just choose one of our Top Brokers in the list above to get all this free.