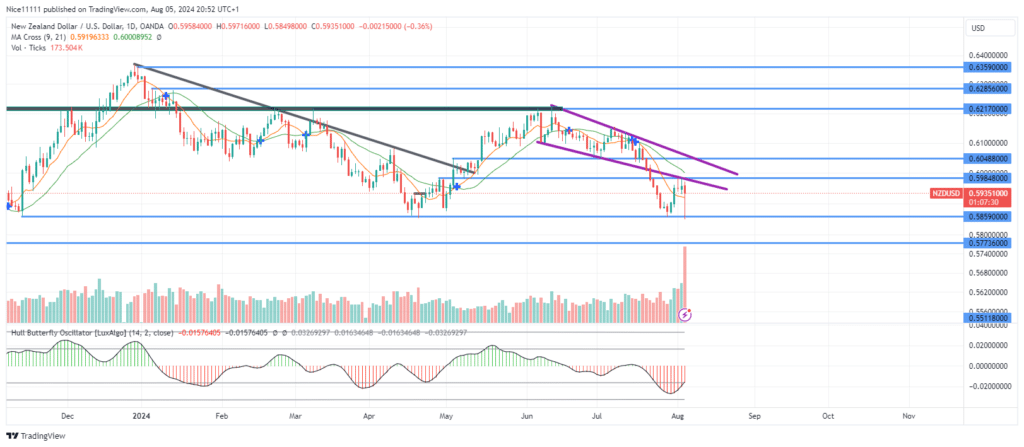
The NZDUSD market has seen a bearish breakout from a descending channel this August. The price has fallen to the demand zone at 0.5860 and, subsequently, retraced to retest the falling wedge formation. This retracement phase provides further insights into the current market dynamics and potential future movements.
NZDUSD Key Levels:
Demand Levels: 0.5860, 0.5770, 0.5510
Supply Levels: 0.6220, 0.6290, 0.6360
NZDUSD Long-Term Trend: Bearish
The daily chart vividly depicts the bearish characteristics of the falling wedge. The recent downside breakout from this formation has led to a noticeable increase in selling momentum. This bearish trend has been reinforced by a pullback that tested a bearish order block.
Additionally, the Moving Averages (Periods 9 and 21) remain positioned above the daily candles, indicating a persistent downward trend. This is further exemplified by six consecutive bearish daily candles, which display a pronounced slope toward the demand level of 0.5860, underscoring strong bearish momentum.
NZDUSD Short-Term Trend: Bearish
In the short term, the price has bounced off the demand zone and is currently engaged in retesting the falling wedge. On lower timeframes, a double top pattern has emerged at this retest, signaling a likely continuation of the bearish trend. Additionally, the Moving Averages (Periods 9 and 21) remain positioned above the daily candles on the 4-hour chart, reinforcing the anticipation of a resumption of the downward movement.
Trade on MT4 with Leverage up to 1:500! Trade on MT4 with Leverage up to 1:500!
X
We use cookies to ensure that we give you the best experience on our website. If you continue to use this site we will assume that you are happy with it.

 NZDUSD Short-Term Trend: Bearish
 NZDUSD Short-Term Trend: Bearish


