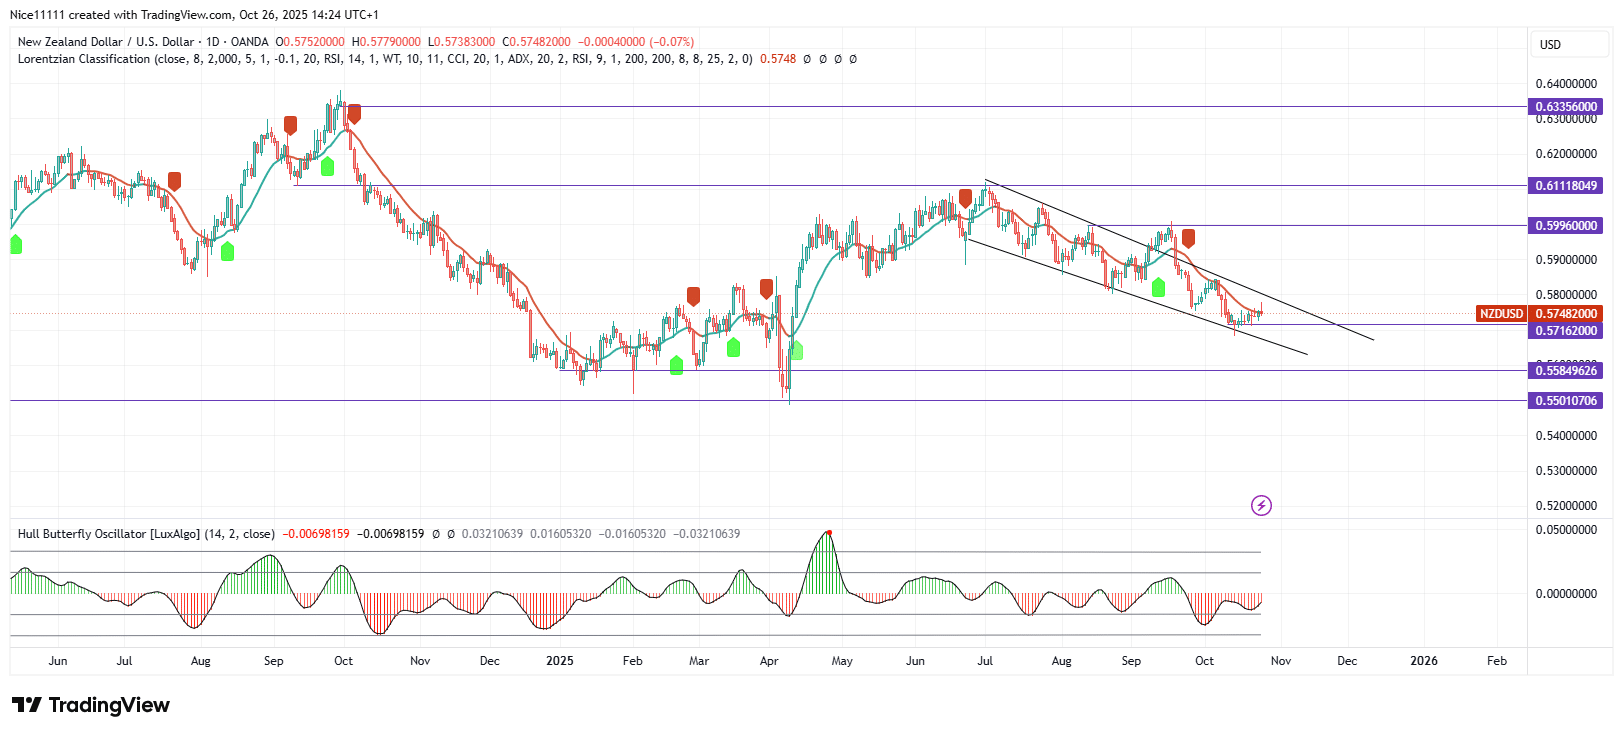
NZDUSD has been in a clear downtrend since a major price shift occurred in August. Since then, the pair has continued to decline, gradually drilling deeper into lower price territories while moving within a well-defined bearish parallel channel. Sellers remain dominant, and every small recovery has eventually led to another downward push.
NZDUSD Key Levels
Demand Levels: 0.57160, 0.55850, 0.55010
Supply Levels: 0.59960, 0.61110, 0.63360
NZDUSD Long-Term Trend: Bearish
In August, the failure swing during the price shift confirmed the change in structure. Afterwards, a clear three falling peak pattern formed, validating the bearish sentiment.
.
Interestingly, in September, the price briefly moved above the channel. However, it quickly crashed back inside the structure. That move caused confusion in indicator behavior for a short period. For instance, the Machine Learning Lorentizan Classification indicator flashed a temporary buy signal before reverting to a strong sell setup. Likewise, the Hull Butterfly Indicator showed a short-lived disturbance before realigning with the bearish momentum. Therefore, the downtrend remains intact despite the temporary retracement.
NZDUSD Short-Term Trend: Bullish
On the lower timeframe, the pair is forming higher lows and slowly moving toward the resistance boundary of the channel. This shows a bullish retracement within a broader bearish environment. However, the sluggish upward movement suggests that strong sellers are likely waiting at key supply zones. Therefore, while the short-term push upward may continue, aggressive short positions could dominate once the price meets major resistance areas.
Trade on MT4 with Leverage up to 1:500! Trade on MT4 with Leverage up to 1:500!
X
We use cookies to ensure that we give you the best experience on our website. If you continue to use this site we will assume that you are happy with it.

 NZDUSD Short-Term Trend: Bullish


