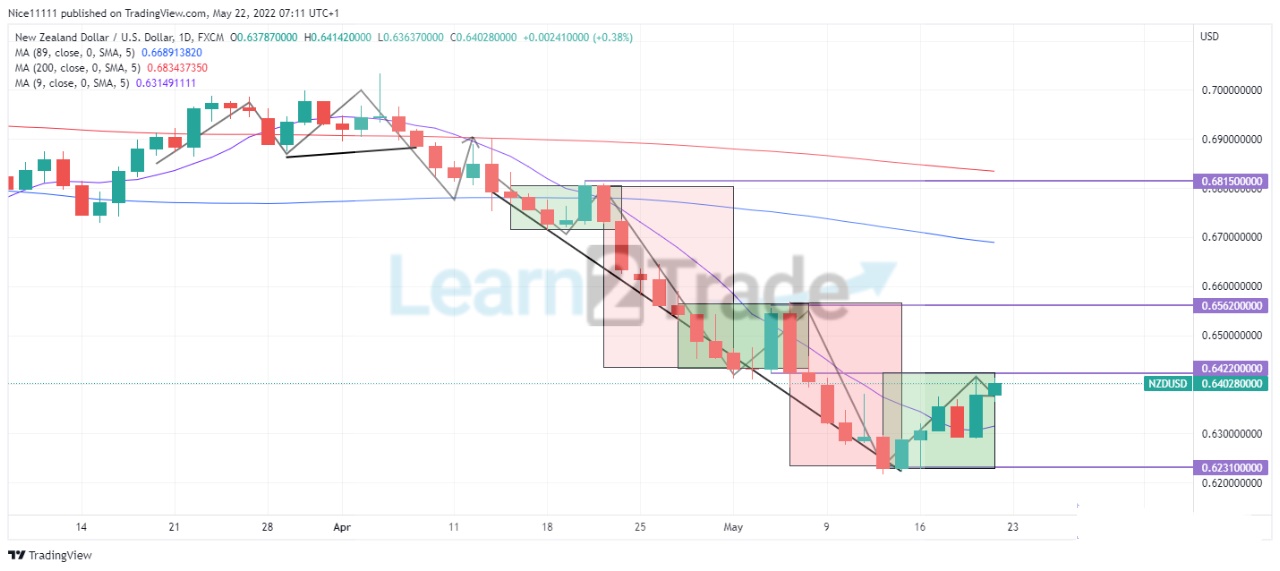
NZDUSD makes a bullish retracement within the downtrend. The market trend is obviously bearish on the daily timeframe. The market has formed a stair-step pattern to lower prices. The market reversed in April from being bullish to bearish. After the reversal, a wave of impulsive and correction moves has been following each other consistently. The correction is seen in the sideways movement of the market in consolidation. The impulsive moves are seen in the large and consecutive bearish candles. The impulsive moves after the reversal have occurred in the form of breakouts to the downside.
NZDUSD Major Zones
Resistance levels: 0.68150, 0.65620 Support levels: 0.62310, 0.64220
NZDUSD Long Term Trend: Bearish
The market reversed in April after a major low failed to hold. On the 29th of May, the low of the day formed the last low before the reversal. The bearish candle formed on the 8th of April confirmed a trend change as it swept past the low. A bullish retracement was spotted on the 12th of April. The bullish candle struck the Moving Average period of eighty-nine (red).
The Moving Average formed resistance in the market. This caused the bears to sell heavily. The Moving Average period two hundred eventually confirmed the bearish trend. The price of NZDUSD fell for four consecutive days. The market dip was temporarily halted on the 19th of April. A swing low formed, which led to a bullish retracement. The market faced resistance at $0.68510. The bears continued the downward move from the resistance zone.
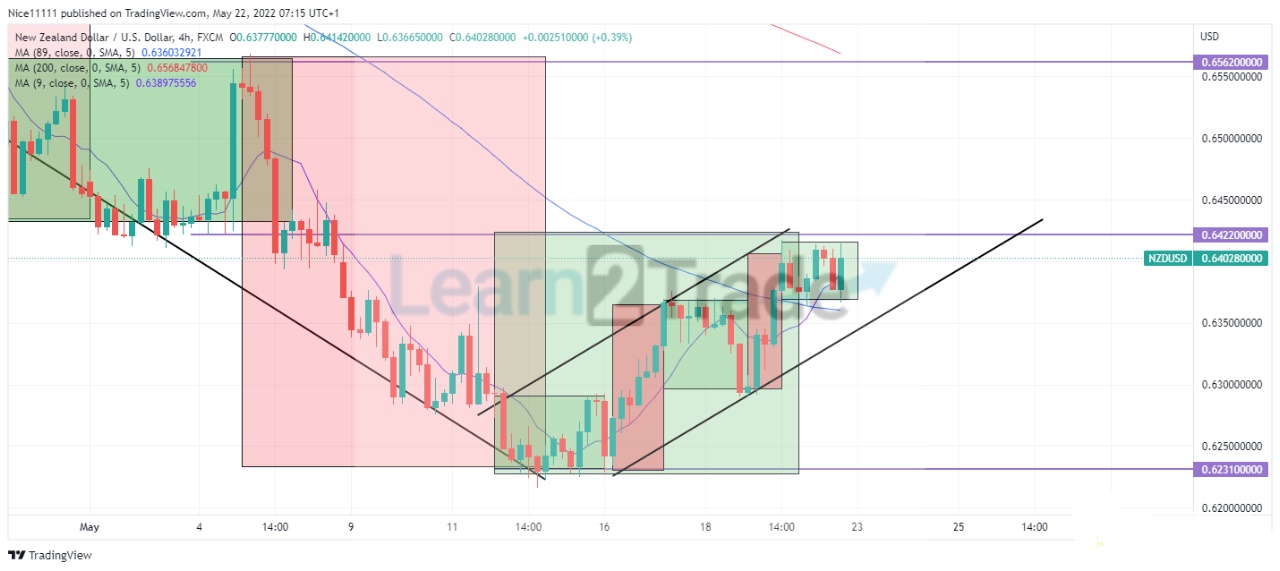
NZDUSD Short Term Trend: Bullish
The last impulse on the daily chart was initiated on the 5th of May. There was a breakout of the market range. The market dipped to $0.632. On the higher timeframe, the market is currently experiencing a very bearish but currently bullish retracement. An uptrend can be seen in the lower timeframe with an impulse to the upside. The market is expected to resume its bearish move at $0.64220 to aim for $0.6231.
Note:Learn2.trade is not a financial advisor. Do your research before investing your funds in any financial asset or presented product or event. We are not responsible for your investing results.
Trade on MT4 with Leverage up to 1:500! Trade on MT4 with Leverage up to 1:500!
X
We use cookies to ensure that we give you the best experience on our website. If you continue to use this site we will assume that you are happy with it.