The NZDUSD currency pair has recently experienced a significant bullish surge, leading to a notable change in market direction. The newfound strength emerged with considerable momentum; however, this momentum is now showing signs of decline.
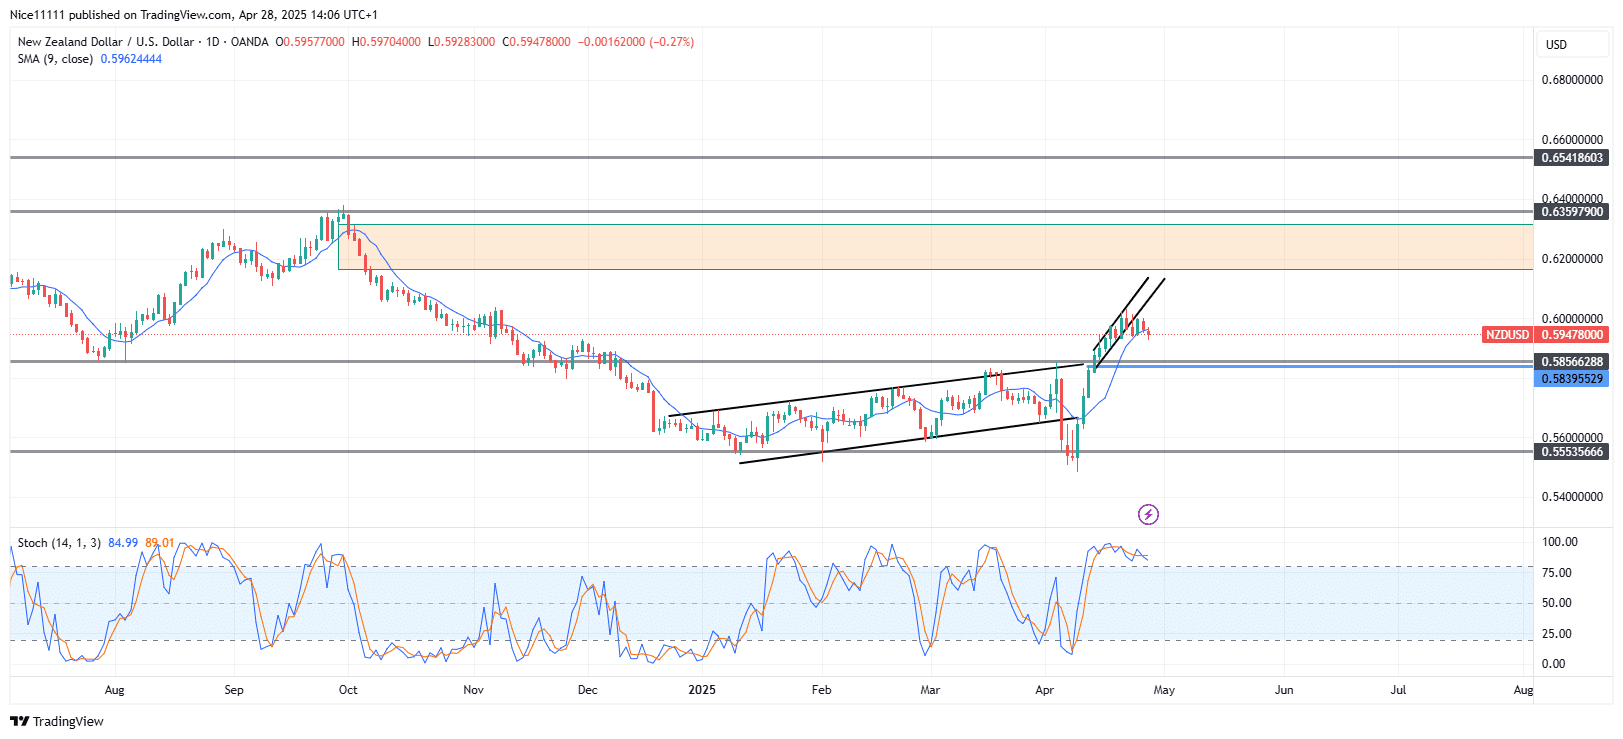
In April, NZDUSD tested the crucial support level of 0.5550, where the formation of three consecutive bullish candlesticks, known as the “three white soldiers,” signaled a change in price direction. This pattern revealed the formidable strength of buyers, who propelled the price upward with remarkable speed, resulting in the formation of fair value gaps.
Below the resistance level lies a region of fair value gap below 0.6360. The price ascended towards this region with high momentum, driven by strong buying interest. However, the momentum is currently waning, evident from the formation of an arc shape and the recent appearance of bearish candlesticks. The price has retreated slightly below the Moving Average, indicating a retracement. Furthermore, the Stochastic Oscillator suggests that the price is overbought, which may be contributing to the decline in momentum.
NZDUSD Short-term Trend: Bullish
On the four-hour timeframe, the price has broken out of a narrow bullish parallel channel due to the ongoing retracement. This development indicates that the bullish momentum has started to exhaust. A push above the 0.6000 level would likely revitalize the bullish trend. Currently, the price is retracing back to 0.5860, and traders will be watching for potential buying opportunities at this level. In conclusion, while the long-term trend remains bullish, the short-term trend is showing signs of weakness. Traders should closely monitor key levels and momentum indicators to gauge the pair’s next move.
Trade on MT4 with Leverage up to 1:500! Trade on MT4 with Leverage up to 1:500!
X
We use cookies to ensure that we give you the best experience on our website. If you continue to use this site we will assume that you are happy with it.

 NZDUSD Short-term Trend: Bullish
 NZDUSD Short-term Trend: Bullish


