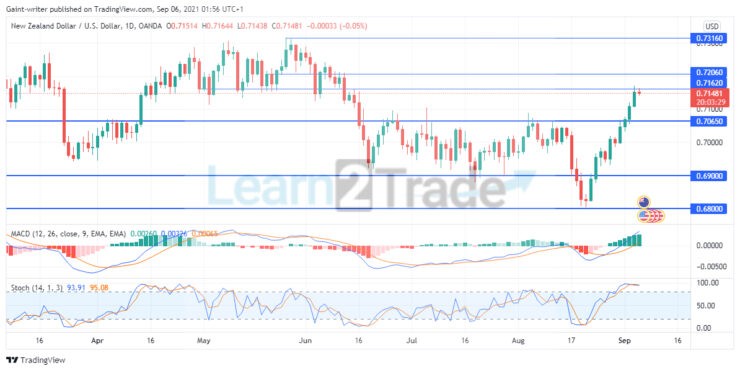
NZDUSD is set to lose its bullish momentum as sellers continue to add more pressure to the market. There has been a market shift as price begins to consolidate between the significant key levels of 0.73160 and 0.71620. Price then broke through the 0.71620 significant level, indicating that the bears were in control, before reversing at the 0.69000 support key level.
NZDUSD Significant Zone
Resistance Levels: 0.73160, 0.77060, 0.70650 Support Levels: 0.68000, 0.69000, 0.71620
NZDUSD Long Term Trend: Bearish
Following that, the NZDUSD began to consolidate once more. However, as the price accumulated between the key levels of 0.70650 and 0.69000, there is little momentum between the bulls and bears at this point. The market then broke lower, continuing its bearish trend before reversing upward. After a reversal at the 0.68000 significant zone, the NZDUSD now tends to rise. Price then appears to lose its bullish momentum as the market appears to be pulling back.
However, the Stochastic Oscillator indicator on the 1-day chart shows a golden cross above the 100 level. This indicates that there has been a change in price direction. This is due to a decrease in bullish momentum, and the price is set to pull back. The MACD (Moving Average Convergence and Divergence) indicator indicates an uptrend because the signal lines are above the zero level. This implies that the current bullish market is likely to pull back before resuming its momentum.
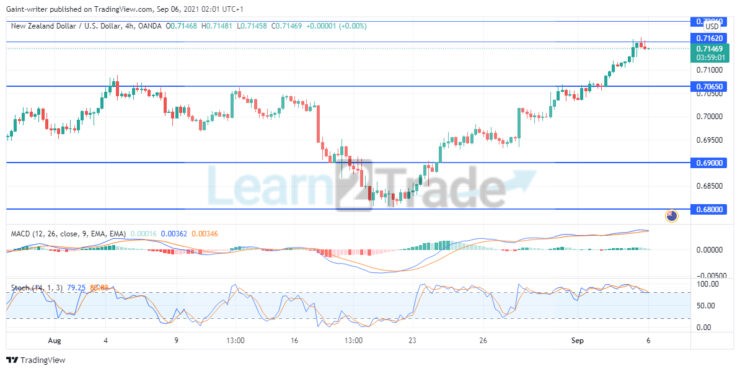
NZDUSD Short Term Trend: Bearish
The market is clearly in an uptrend on the 4-hour chart, with higher lows and highs. As the bulls continue to push the price higher, the bears add pressure, causing retracements. As the green histogram rises, the MACD line rises above the zero level. In the overbought region, Stochastic Oscillators above 100 indicate a change in price direction.
Price is expected to fall back to 0.70650 as the market loses its bullish momentum.
Note:Learn2.trade is not a financial advisor. Do your research before investing your funds in any financial asset or presented product or event. We are not responsible for your investing results.
Trade on MT4 with Leverage up to 1:500! Trade on MT4 with Leverage up to 1:500!
X
We use cookies to ensure that we give you the best experience on our website. If you continue to use this site we will assume that you are happy with it.