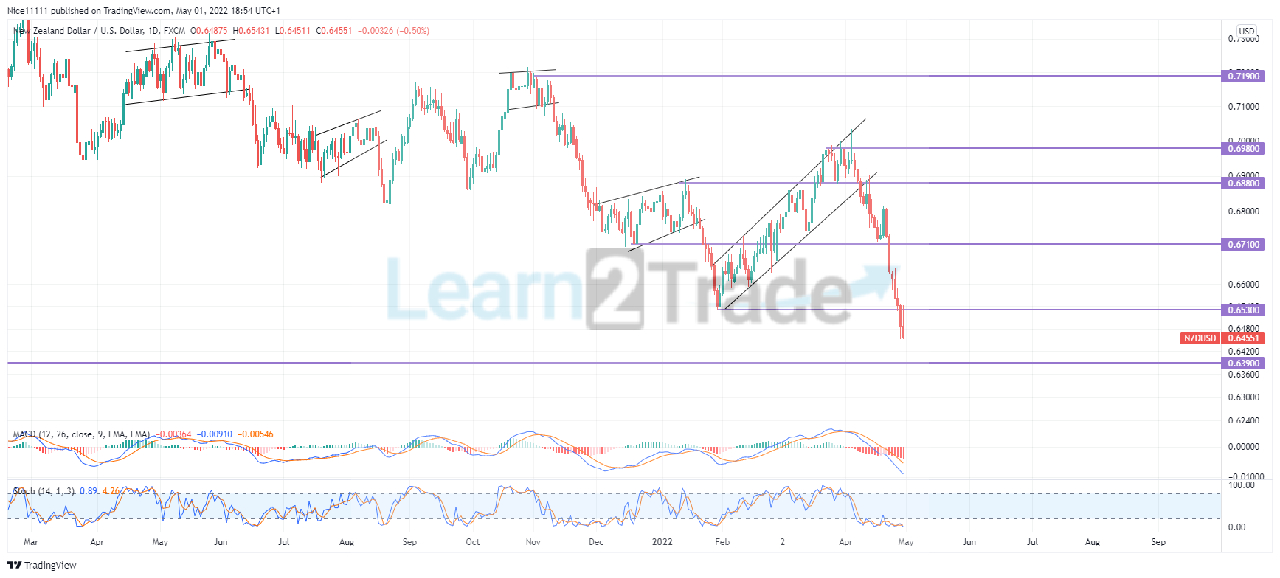
NZDUSD impulsive breakout violates the support zone on the daily timeframe. The market has just completed another phase of correction and impulse. The market was in a phase of consolidation from April to June of last year. The consolidation was the correction phase before the impulsive phase. The MACD EMA lines rested above equilibrium all through the three months of correction. This signified that the market was at a premium. Three black crows formed the impulse just after the whole correction phase.
NZDUSD Major Market Zones:
Support zones: 0.06390, 0.6530, 0.6710. Resistance zones: 0.7190, 0.6980, 0.6880.
NZDUSD Long Term Trend: Bearish
The three falling crow chart pattern created the impulsive breakout from the correction phase multiple times. Three black crows formed the impulsive breakout from the consolidation that abounded in August last year. Similarly, three black crows formed an impulsive breakout from November 9th to the 11th. The breakout violated the correction beneath the resistance level at 0.7190.
The previous year ended with the initiation of a correction phase. The market gyrated between the 0.6880 resistance level and the 0.6710 support level. The market seemed to rise from December into January, but the whole move was still part of a consolidation. On the 13th of January, the Stochastic revealed that the market was in an overbought region. The resistance zone at 0.6880 helped the bears to successfully push through 0.6710. The change in the market direction from bullish was successful. The market eventually dipped to a lower support zone at 0.6390.
NZDUSD Short Term Trend: Bearish
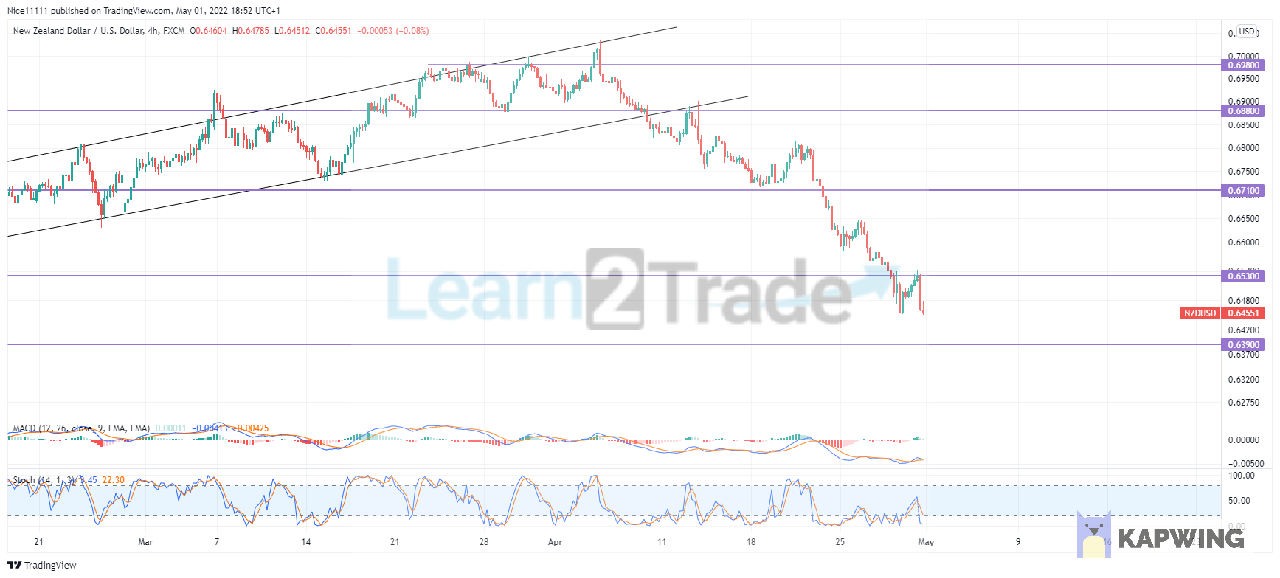
A larger correction formed after the impulsive breakout. The market formed higher highs and lows as it ascended in the parallel channel to 0.6980. A double-top pattern was formed between 0.6980 and 0.6880. This led to a reversal. The market crashed with an impulsive breakout to violate the supply zone at 0.6530. The Stochastic and the MACD are showing an oversold condition. The market is likely to reach the support zone at 0.6390 before it forms a reversal.
Note:Learn2.trade is not a financial advisor. Do your research before investing your funds in any financial asset or presented product or event. We are not responsible for your investing results.
Trade on MT4 with Leverage up to 1:500! Trade on MT4 with Leverage up to 1:500!
X
We use cookies to ensure that we give you the best experience on our website. If you continue to use this site we will assume that you are happy with it.