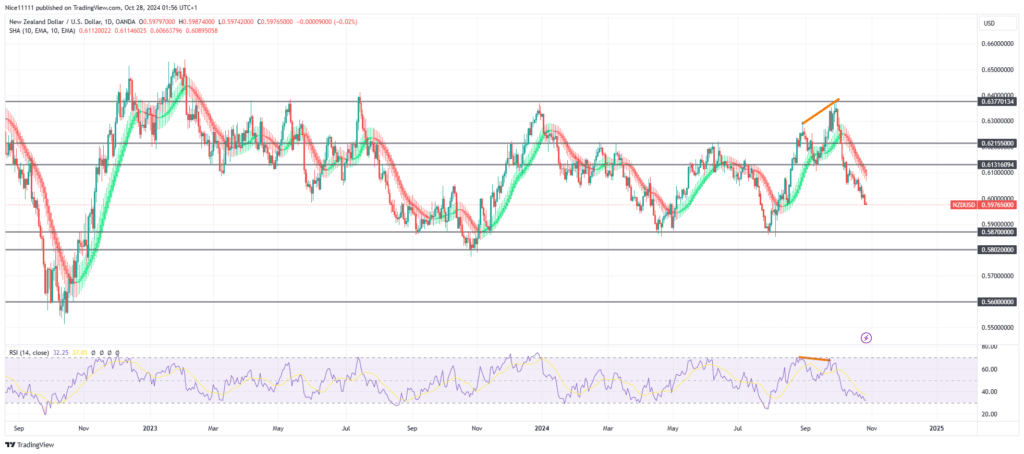
NZDUSD is approaching a critical liquidity region at 0.58680, a significant support zone that previously halted bearish momentum with double tests in April and July. This region, reinforced by prior demand, may once again provide a base for the price to stabilize, potentially curbing the current descent.
NZDUSD has been in a downtrend, with a temporary peak forming a higher high at 0.63670 in October. However, the RSI (Relative Strength Index) displayed a lower high during this rise, signalling bearish divergence and underlying market weakness. This divergence indicated a loss of momentum in the uptrend, casting doubt on the strength of recent bullish moves.
The break below the swing low at 0.61320 confirmed a bearish shift in market structure. Smoothened Heikin Ashi candles have also been repositioned above daily candles, showing a consistent red hue to emphasize the clarity of the downtrend.
NZDUSD Short-term Trend: Bearish
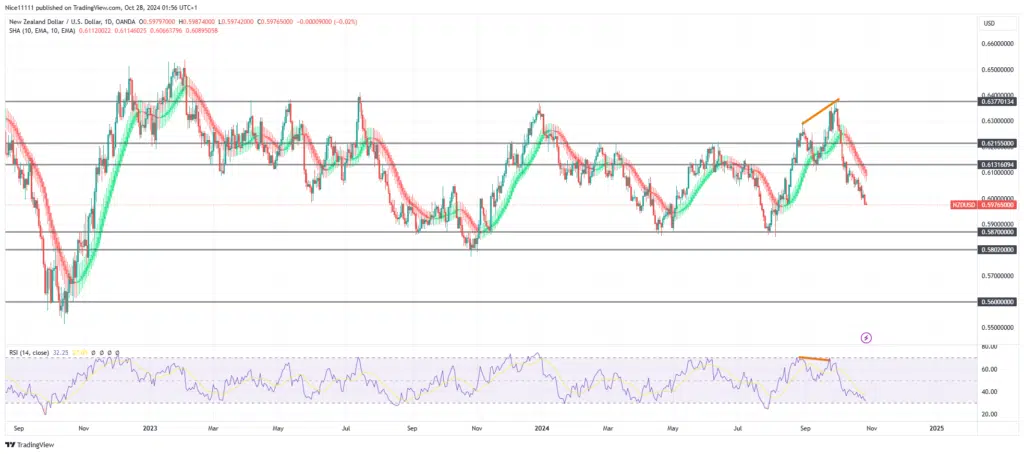
On the lower timeframe, the market structure continues with an orderly flow of lower highs and lows, aligning with bearish momentum. The Smoothed Heikin Ashi candles further reinforce this downtrend, acting as resistance along the descent. Price is accelerating toward the demand zone at 0.58700, an area featuring relatively equal lows, which typically attract high liquidity. If this demand zone holds, it could offer a temporary support level; however, sustained selling pressure may prompt a deeper retracement toward subsequent demand levels.
With high liquidity expected around 0.58700, traders should closely monitor the zone for potential reversal signals or increased bearish continuation in line with the prevailing downtrend to generate accurate forex signals.
Trade on MT4 with Leverage up to 1:500! Trade on MT4 with Leverage up to 1:500!
X
We use cookies to ensure that we give you the best experience on our website. If you continue to use this site we will assume that you are happy with it.
 NZDUSD Short-term Trend: Bearish
 NZDUSD Short-term Trend: Bearish


