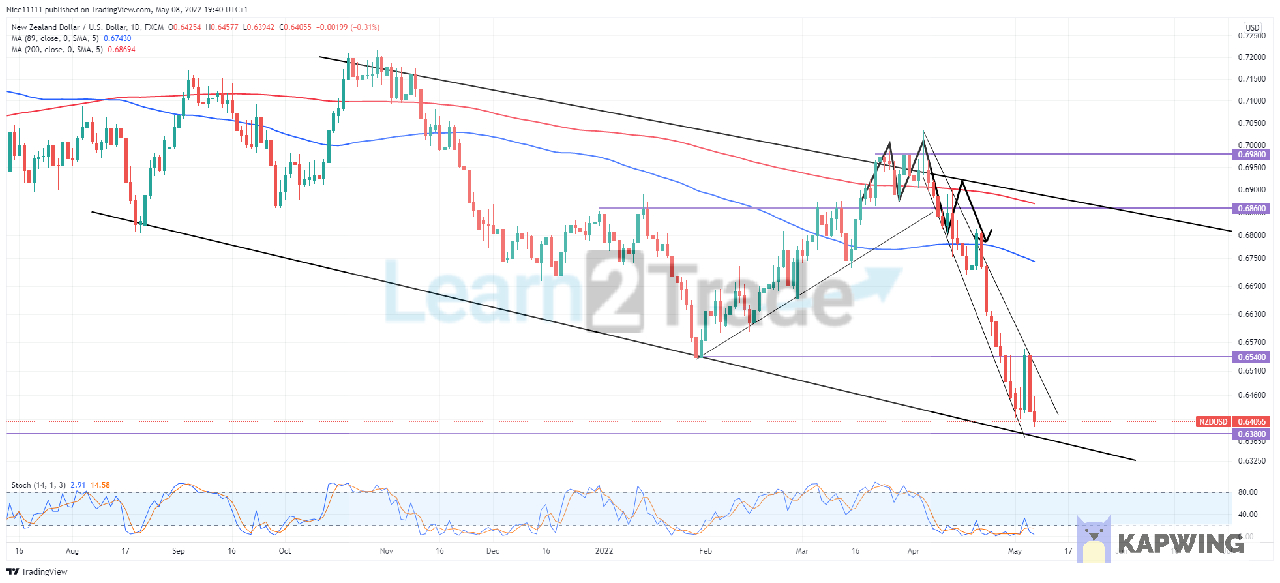
NZDUSD dips into an oversold level with the recent push through 0.6540. The market has been in a downtrend on the daily chart. The Moving Average period eighty-nine crossed the Moving Average period 200 to the downside during August last year. Ever since then, the market has been bearish. The parallel channel also clearly signifies the reign of the sellers in the market.
NZDUSD Key Levels
Support levels: 0.6380, 0.6540 Resistance levels: 0.6980, 0.6860
NZDUSD Long Term Trend: Bearish
On the 20th of August 2021, after the cross of the Moving Averages, the market dipped into the oversold level on the stochastic. The result was seen as a strong bullish rally. The market created a higher high and a lower low that soared past the Moving Averages. The Moving Averages still indicated the market was bearish overall. The bears eventually continued the ride.
During February this year, the market dipped into the oversold level again. This caused the bears to halt at 0.6540. The buying pressure at the oversold level moved the market to break the resistance at 0.6860. The bulls did not halt until they got exhausted at 0.6980. The market was already overbought and a double top had formed.
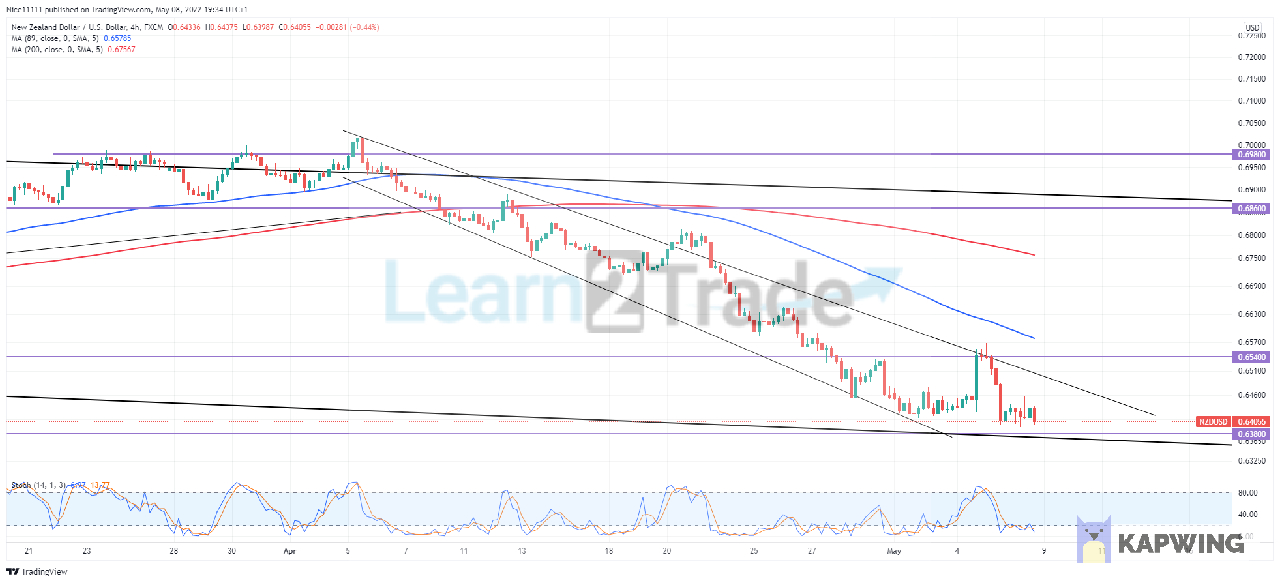
NZDUSD Short Term Trend: Bearish
The market has dipped into the oversold level at 0.6540. The market is oversold and is expected to use the next support zone for a reversal. The push-through 0.6540 was followed by a retest of the level. The market is expected to reach 0.6389 soon as it is already near.
Note:Learn2.trade is not a financial advisor. Do your research before investing your funds in any financial asset or presented product or event. We are not responsible for your investing results.
Trade on MT4 with Leverage up to 1:500! Trade on MT4 with Leverage up to 1:500!
X
We use cookies to ensure that we give you the best experience on our website. If you continue to use this site we will assume that you are happy with it.