NZDUSD is gaining upward traction as buyers push the pair toward a key resistance zone. Recent momentum has lifted the price off its lows, with bullish pressure now testing an area that could decide whether the recovery extends further or stalls against stronger selling interest. The market is currently at a pivotal stage, where short-term strength faces the weight of the broader bearish outlook.
NZDUSD Key Levels
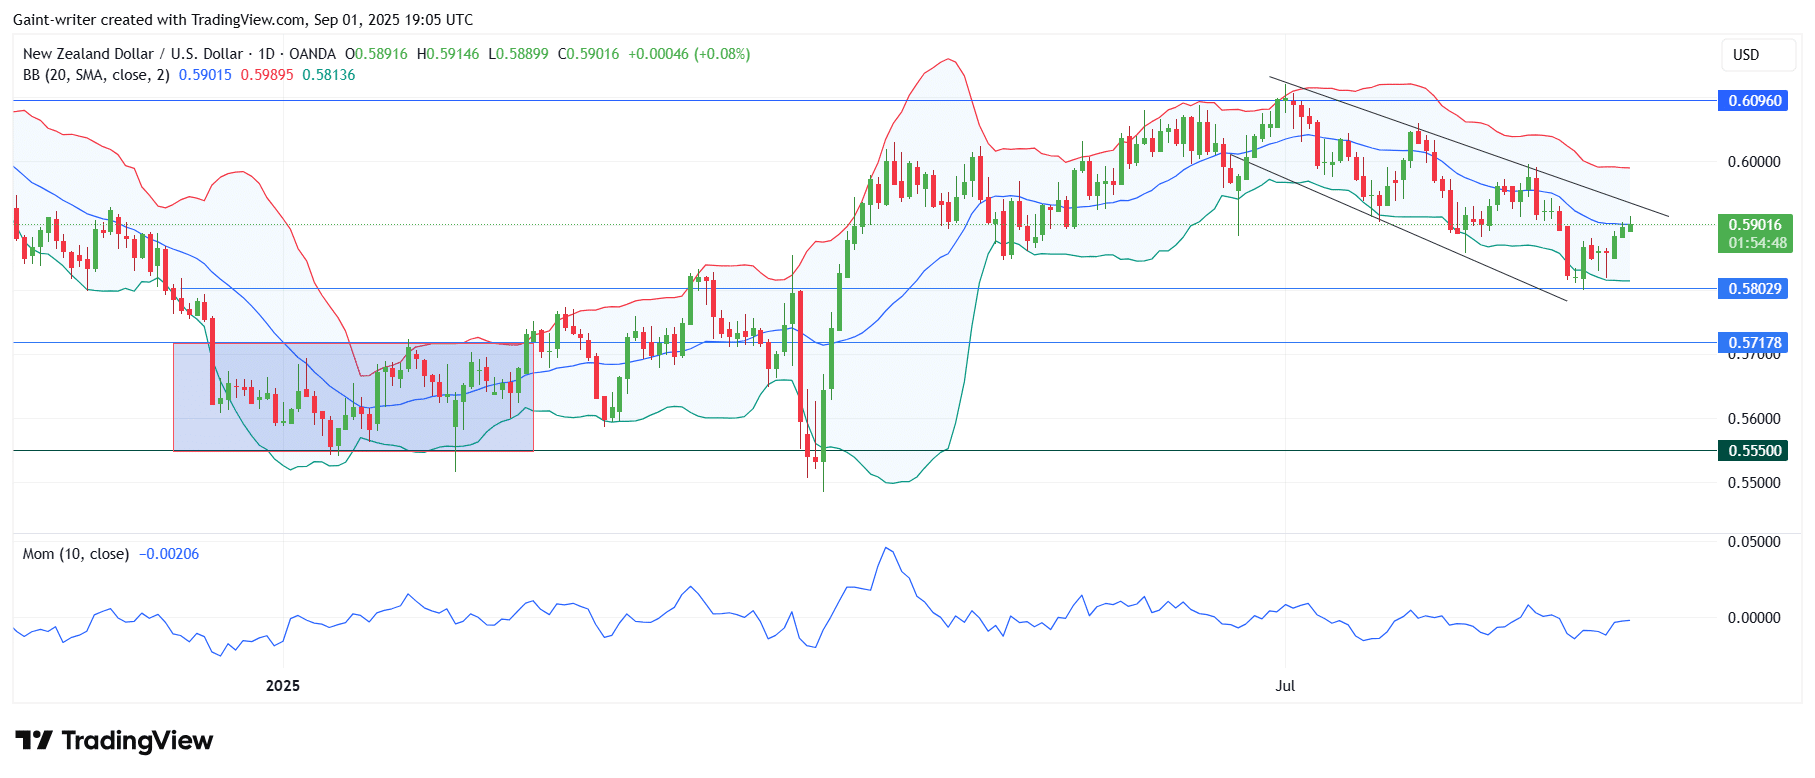
Support Levels: 0.5800, 0.5710
Resistance Levels: 0.6090, 0.6200
NZDUSD Long-Term Trend: Bearish
The bulls have shown dominance over the past few days. Despite the market being in a descending channel, the bulls managed to push higher. The most recent price action has been a corrective bounce from the lower boundary as buyers aim higher. The buyers are testing the 0.5900 key level, and very soon, sellers could push back.
.
Currently, the price has crossed through the mid-level of the Bollinger Band Indicator. The Momentum indicator, while still negative, has hooked up sharply. This confirms the strength of this relief rally but also shows that the larger bearish trend has not yet been fully negated.
NZDUSD Short-Term Trend: Bullish
On the 4-hour chart, NZDUSD is trading around 0.5900 after a steady climb since late August. The pair has been respecting the middle Bollinger Band as support, steadily moving higher toward a key resistance zone. Price is now pressing against the upper Bollinger Band, reflecting strong bullish momentum. That said, the Momentum indicator is beginning to flatten, hinting that buying strength may be slowing as the market tests this critical barrier.
Trade on MT4 with Leverage up to 1:500! Trade on MT4 with Leverage up to 1:500!
X
We use cookies to ensure that we give you the best experience on our website. If you continue to use this site we will assume that you are happy with it.

 NZDUSD Short-Term Trend: Bullish
 NZDUSD Short-Term Trend: Bullish


