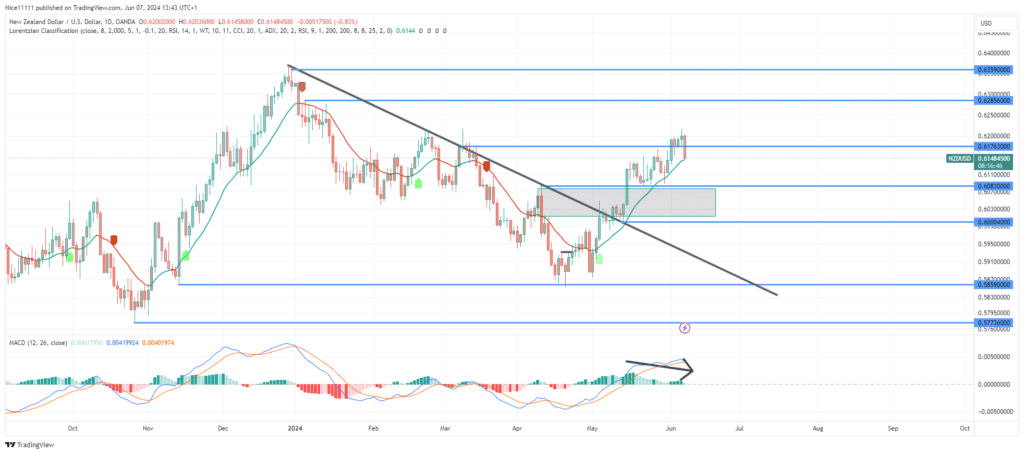
NZDUSD is currently exhibiting a bullish market delivery. The price has successfully pushed above the resistance level of 0.6180. While the overall market structure remains bullish, recent price action and indicators on the daily chart suggest a decrease in momentum.
The Lorentizan Classification indicator, known for providing reliable forex signals, indicated a buy on May 3, 2024. Before this signal, the MACD (Moving Average Convergence Divergence) histogram had turned green and was gradually growing in size, signalling increasing momentum. Following these signals, the price successfully pushed above the resistance line on the daily chart.
However, since breaking the resistance level at 0.6180, the MACD has shown signs of declining momentum. The gap between the MACD line and the Signal line is narrowing, indicating a decrease in momentum. Similarly, the histogram bars are gradually diminishing in size, and their hue is fading gently.
NZDUSD Short-Term Trend: Bullish
The price has dipped into a bullish order block below 0.6180. Testing this bullish order block is expected to support the resumption of the upward trend. Traders should remain observant as declining momentum may eventually generate bearish forex signals. However, until there is a bearish shift in market structure, the bullish trend remains intact for long orders.
Note: Learn2.trade is not a financial advisor. Do your research before investing your funds in any financial asset or presented product or event. We are not responsible for your investing results.
Trade on MT4 with Leverage up to 1:500! Trade on MT4 with Leverage up to 1:500!
X
We use cookies to ensure that we give you the best experience on our website. If you continue to use this site we will assume that you are happy with it.

 NZDUSD Short-Term Trend: Bullish
 NZDUSD Short-Term Trend: Bullish


