Market Analysis – May 7
NZDUSD has experienced a price reversal on the daily timeframe. The market turned bullish after dipping into the oversold region, as signaled by the Williams Percent Range Indicator. The surge in the price has caused an ascent above the previous high of 0.63170.
NZDUSD Significant Zones
Demand Zones: 0.61560, 0.60870, 0.59690
Supply Zones: 0.63170, 0.64170, 0.65380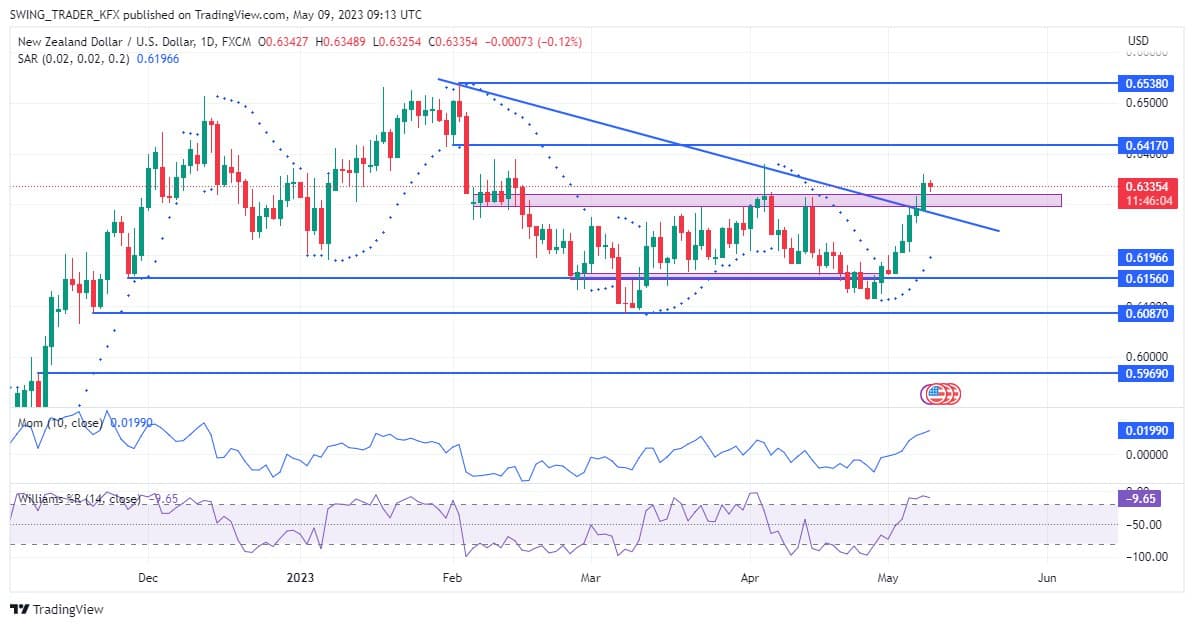
NZDUSD Long-term Trend: Bullish
NZDUSD’s bearish trend resumed with a Gravestone Doji candlestick on April 5, 2023. The price plummeted, leaving inefficiently traded regions, which served as a pullback opportunity. The retracement into the fair value gap provided shorting opportunities for the Bears. The Williams %R (Williams Percent Range) was overbought. The Parabolic SAR also indicated the resumption of the long-term trend in play. The price was delivered successfully beyond the support level of 0.61650.
The buying pressure at the support level of 0.61560 has fostered a bullish takeoff. The price escaped immediately from the oversold region on the 27th of April (as seen on the Williams Percent Range). The Momentum indicator also shows a significant increase in bullish momentum. The previous high of 0.61560 has been broken.
NZDUSD Short-term Trend: Bullish
The short-term trend aligns perfectly with the long-term trend. The Parabolic SAR (Stop and Reverse) is supporting the market’s ascent. The price is expected to rise to the daily bullish order block of 0.64170.
Do you want to take your trading to the next level? Join the best platform for that here
- Broker
- Min Deposit
- Score
- Visit Broker

- Award-winning Cryptocurrency trading platform
- $100 minimum deposit,
- FCA & Cysec regulated

- 20% welcome bonus of upto $10,000
- Minimum deposit $100
- Verify your account before the bonus is credited
- Fund Moneta Markets account with a minimum of $250
- Opt in using the form to claim your 50% deposit bonus
Learn to Trade
Never Miss A Trade Again

Signal Notification
Real-time signal notifications whenever a signal is opened, closes or Updated

Get Alerts
Immediate alerts to your email and mobile phone.

Entry Price Levels
Entry price level for every signal Just choose one of our Top Brokers in the list above to get all this free.