NZDUSD shows clear bearish pressure, trading within a well-defined descending channel. After a recent rejection from the upper boundary, sellers have regained control, increasing the likelihood of a move toward the channel’s lower support.
NZD/USD Key Levels
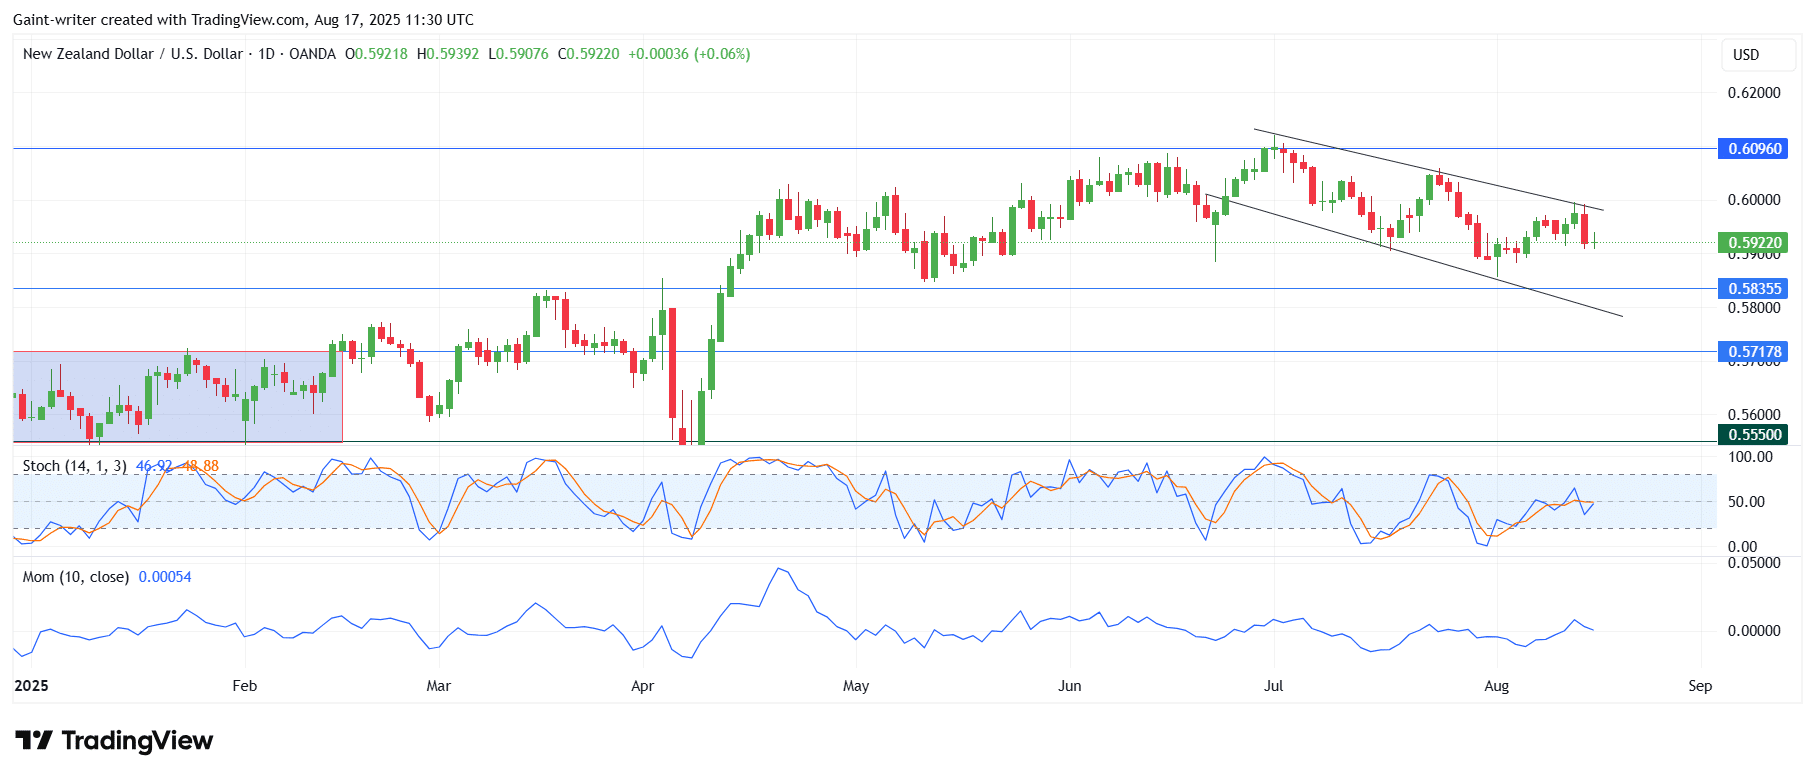
Support Levels: $0.5830, $0.5710
Resistance Levels: $0.6096, $0.6200
NZDUSD Long-Term Trend: Bearish
On the daily chart, the NZD/USD has been trending downward within a bearish channel since peaking in July. The consistent pattern of lower highs and lower lows confirms a controlled downtrend, following earlier bullish momentum. Currently, the pair trades around $0.5922, navigating between dynamic resistance and support levels.
.
Although the pair rebounded from the channel’s lower boundary in early August, upward momentum is fading as it approaches the upper half of the formation. Unless buyers break above the upper trendline, the pair will likely retest lower levels. The Stochastic Oscillator sits neutrally at 49.42, while the Momentum indicator barely registers above zero at 0.00004, reinforcing the lack of strong bullish conviction.
NZDUSD Short-Term Trend: Bearish
The lower timeframe further confirms bearish dominance, with the pair now at $0.5922 after a decisive rejection from the $0.6000 psychological level. This reinforces the descending channel’s validity and highlights seller control in the near term.
The immediate trajectory points downward, with the next target at the channel’s lower trendline. Additionally, the Momentum indicator has turned negative (-0.00056), aligning with the recent decline and confirming bearish momentum.
Trade on MT4 with Leverage up to 1:500! Trade on MT4 with Leverage up to 1:500!
X
We use cookies to ensure that we give you the best experience on our website. If you continue to use this site we will assume that you are happy with it.

 NZDUSD Short-Term Trend: Bearish
 NZDUSD Short-Term Trend: Bearish


