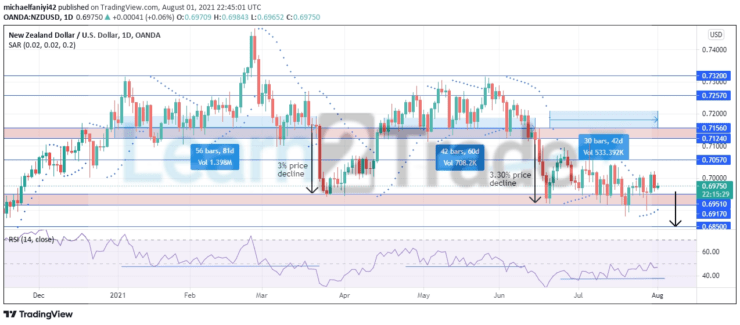
NZDUSD is in danger of reaching new lows for the year as bears increase pressure on the 0.69510 – 0.69170 weekly support. The market has been knocking down on this weekly support for the past 30 trading days now. This bearish agenda is sustained by the 0.70570 resistance, which is acting as a lid to oppose the upward movement of the market. Already there seemed to be a breakthrough on the 20th of July 2021, but sellers weakened and recoiled back above the support. The same thing happened again on the 28th.
Key Levels
Resistance Levels: 0.70570, 0.71560, 0.72570 Support Levels: 0.68500, 0.69170, 0.69510
NZDUSD Long Term Trend: Bearish
This pattern of turning up the heat on a major support is something that NZDUSD has played out at least twice this year. The first time was from the beginning of the year to the 22nd of March, after which price dropped by 3% to the 0.69510 – 0.69170 weekly support. Kiwi recovered to climb back above 0.71560, at which point bears employed the pressure increase pattern again. This time the pressure lasted 42 trading days, after which, on the 16th of June 2021, price fell 3.30% back to 0.69510.
Sellers are not relenting and are planning to dig deeper. They immediately employed this same pressure increase formation to sink the market. This agenda has been on since the 18th of June and has lasted 30 days now. The 0.69510 – 0.69170 weekly support is doing its best to keep the kiwi up, but may soon give way like in previous times. Currently, the market has been pushed up. The Parabolic SAR (Stop and Reverse) has its dots below the daily candles to show the current strength of the support.
NZDUSD Short Term Trend: Ranging
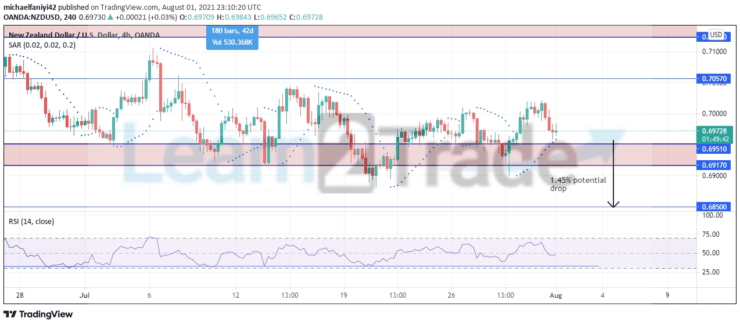
The 0.69510 – 0.69170 weekly support remains tenacious. This is confirmed by the Parabolic SAR, which has several dots below the 4-hour candles. This means that kiwi will continue in sideways movement till it finally gets an opportunity to bore through.
This setup is also reflected on the RSI (Relative Strength Index) chart. Its signal line is bouncing on a straight line at the 33.67 level, looking for a weak point to exploit to go below. It is predicted that bears will eventually find a way through with the 0.68500 support in view.
Note: Learn2.trade is not a financial advisor. Do your research before investing your funds in any financial asset or presented product or event. We are not responsible for your investing results
Trade on MT4 with Leverage up to 1:500! Trade on MT4 with Leverage up to 1:500!
X
We use cookies to ensure that we give you the best experience on our website. If you continue to use this site we will assume that you are happy with it.