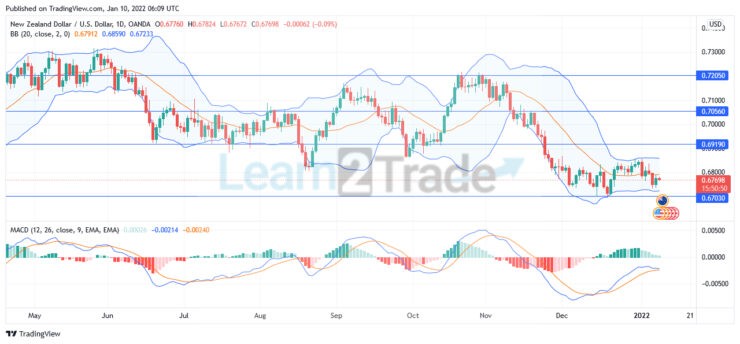
NZDUSD bearish threat is close to an edge around the 0.67030 price level following a downpour. The market had longed to be moved by the bears’ solid inspiration. This implies that the price action has been strongly inspired by the seller’s prospect. The bear’s menace is now seen to be on the decrease just as the momentum continues to decrease. When the price impulse gets to the 0.67030 level, the bear’s movement will come to an end as the impulse decreases.
NZDUSD Important Levels:
Resistance Levels: 0.72050, 0.70560 Support Levels: 0.69190, 0.67030
NZDUSD Long Term Trend: Ranging
Price movement first looked forward to establishing itself following a quick range on the daily chart around the upper region of 0.72050 level of price influence before a bearish trend was noticeable. NZDUSD then fell to continue its rangy price movement around the levels of 0.70560 and 0.69190 price influence. The bulls and the bears are now experiencing tugs of war as they are now moving in a standpoint movement. This tendency then continues till the bears eventually take their level down from the 0.72050 price level.
When price movement moved from the 0.72050 level, the sellers pushed the market to fall with a strong impulse in price influence. The market is being displayed as the Bollinger Band indicator also begins to widen from the 0.72050 level. As the market trades near the 0.69190 level, price movement continues to range before starting to go downward.
NZDUSD Long Term Trend: Bearish
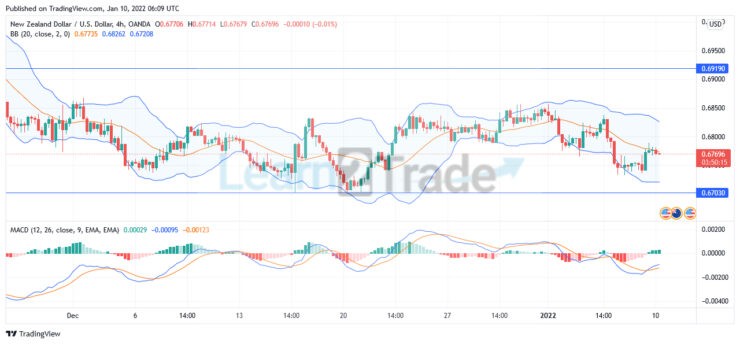
The 4-hour chart of the market showed price movement following a consolidation between the levels of 0.69190 and 0.67030. However, the price is set to move downward following a bearish push before the buyers kick in. The (Moving Average Convergence and Divergence) MACD indicator shows price direction to generally start to follow a bullish market despite still being in sellers’ direction. The price must first reach the 0.67030 level before the bulls kick in.
Note:Learn2.trade is not a financial advisor. Do your research before investing your funds in any financial asset or presented product or event. We are not responsible for your investing results.
Trade on MT4 with Leverage up to 1:500! Trade on MT4 with Leverage up to 1:500!
X
We use cookies to ensure that we give you the best experience on our website. If you continue to use this site we will assume that you are happy with it.