Key Resistance Levels: 0.6600, 0.6800, 0.7000
Key Support Levels: 0.6200, 0.6000, 0.5800
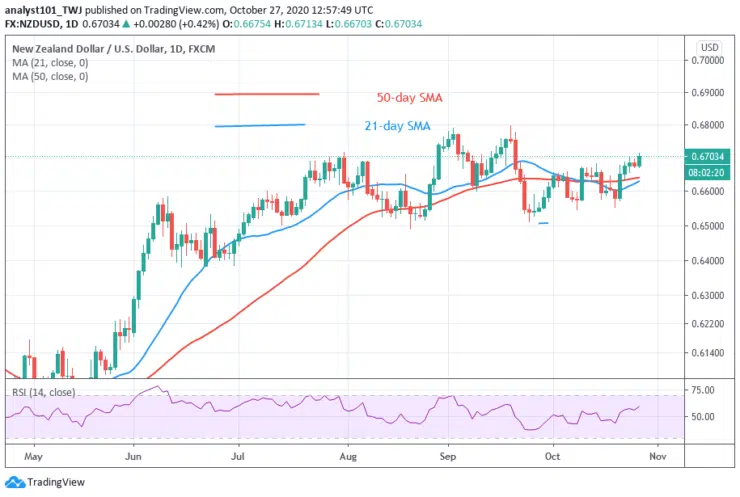
NZD/USD Price Long-term Trend: Bullish
NZD/USD has risen to the overbought region. Since July, the pair has been retesting the overbought region. The pair will reverse as soon as it reaches the overbought region at level o.6700 and 0.6800. Today, the price is reaching the overbought region.
Daily Chart Indicators Reading:
The Kiwi has risen to level 59 of the Relative Strength Index period 14. It indicates that the pair is now in the uptrend zone. The 50-day SMA and 21-day SMA are sloping horizontally indicating the sideways move.
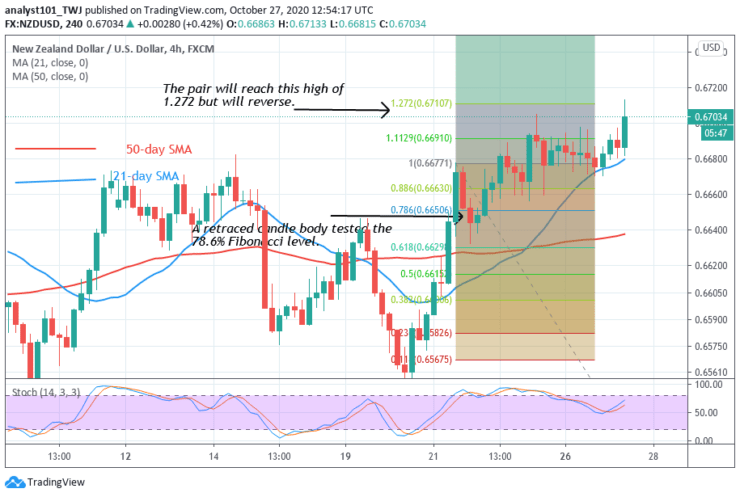
NZD/USD Medium-term Trend: Bearish
On the 4-hour chart, the NZD/USD pair is in an upward move but may reverse as it reaches the overbought region. On October 21 uptrend; a retraced candle body tested the 78.6% Fibonacci level. This retracement indicates that the price will rise and reverse at level 1.272 Fibonacci retracement level. That is at level 0.6710.
4-hour Chart Indicators Reading
The 50-day and 21-day SMAs are sloping upward. It indicates that the pair is in an uptrend. The pair is above the 80% range of the daily stochastic. It indicates that the market is in a bullish momentum and Kiwi is now trading in the overbought region.
General Outlook for NZD/USD
The NZD/USD pair has risen to the overbought region of the market. Sellers may emerge to push prices down. According to the Fibonacci tool, the market will reverse at level 1.272 Fibonacci extension level. That is a low of 0.6710.
Note: Learn2.Trade is not a financial advisor. Do your research before investing your funds in any financial asset or presented product or event. We are not responsible for your investing results
- Broker
- Min Deposit
- Score
- Visit Broker

- Award-winning Cryptocurrency trading platform
- $100 minimum deposit,
- FCA & Cysec regulated

- 20% welcome bonus of upto $10,000
- Minimum deposit $100
- Verify your account before the bonus is credited
- Fund Moneta Markets account with a minimum of $250
- Opt in using the form to claim your 50% deposit bonus
Learn to Trade
Never Miss A Trade Again

Signal Notification
Real-time signal notifications whenever a signal is opened, closes or Updated

Get Alerts
Immediate alerts to your email and mobile phone.

Entry Price Levels
Entry price level for every signal Just choose one of our Top Brokers in the list above to get all this free.