Key Resistance Levels: 0.7000, 0.7200, 0.7400
Key Support Levels: 0.6200, 0.6000, 0.5800
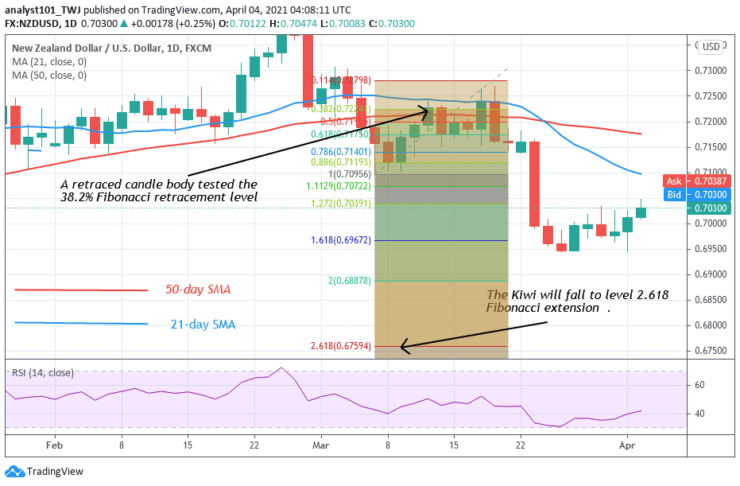
NZD/USD Price Long-term Trend: Bearish
NZD/USD pair has been in a downward move since February 25. The price is making a series of lower highs and lower lows. Today, the Kiwi has fallen to the low 0.7030. On March 5 downtrend; a retraced candle body tested the 38.2% Fibonacci retracement level. The retracement indicates that the Kiwi will fall to level 2.618 Fibonacci extension . That is the low of level 0.6759.
Daily Chart Indicators Reading:
The Kiwi is at level 42 of the Relative Strength Index period 14. It indicates that the pair is in the downtrend zone and capable of falling. The 50-day SMA and 21-day SMA are sloping downward.
NZD/USD Medium-term Trend: Ranging
On the 4-hour chart, the Kiwi fell to level 0.6950 and resumed a range-bound movement. The pair is fluctuating between levels 0.6950 and 0.7030. The downtrend will resume if the current support is breached.
4-hour Chart Indicators Reading
The moving averages are sloping southward indicating the downtrend. The pair is above the 80% range of the daily stochastic. The market is likely to decline as price reaches the overbought region.
General Outlook for NZD/USD
The NZD/USD pair has corrected upward but will soon face rejection as the market reaches the overbought region. The stochastic indicator is in the overbought region of the market while the RSI is in the downtrend zone. The Kiwi is likely to fall.
.
You can purchase crypto coins here: Buy Coins
Note: Learn2.Trade is not a financial advisor. Do your research before investing your funds in any financial asset or presented product or event. We are not responsible for your investing results
- Broker
- Min Deposit
- Score
- Visit Broker

- Award-winning Cryptocurrency trading platform
- $100 minimum deposit,
- FCA & Cysec regulated

- 20% welcome bonus of upto $10,000
- Minimum deposit $100
- Verify your account before the bonus is credited
- Fund Moneta Markets account with a minimum of $250
- Opt in using the form to claim your 50% deposit bonus
Learn to Trade
Never Miss A Trade Again

Signal Notification
Real-time signal notifications whenever a signal is opened, closes or Updated

Get Alerts
Immediate alerts to your email and mobile phone.

Entry Price Levels
Entry price level for every signal Just choose one of our Top Brokers in the list above to get all this free.