Key Resistance Levels: 0.64000, 0.65000, 0.66000
Key Support Levels: 0.58000, 0.57000, 0.56000
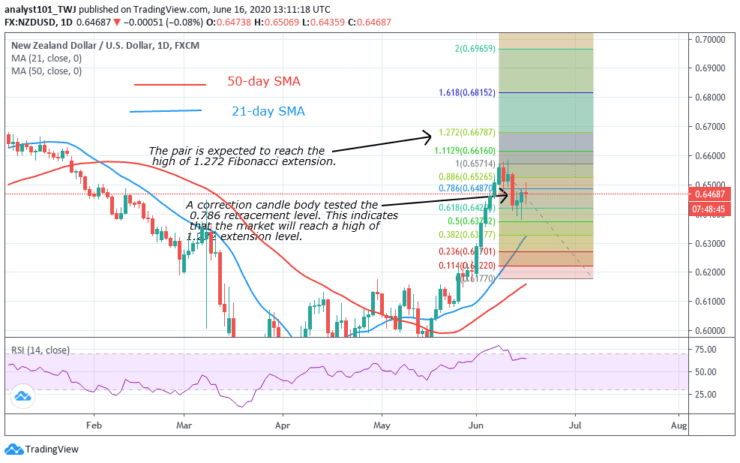
NZD /USD Long-term Trend: Bullish
The New Zealand dollar is in an uptrend as it breaks level 0.62000. A correction candle body tested the 0.786 retracement level. This indicates that the market will reach a high of 1.272 extension level. The Kiwi will rise and reverse at the 1.272 extension level. When the market reverses, price will return to 0.786 retracement level.
Daily Chart Indicators Reading:
The SMAs are sloping upward indicating the uptrend. The SMAs have a bullish crossover. The Kiwi has risen to level 65 of the Relative Strength Index. This indicates that the pair is in the uptrend and also above the centerline 50. The pair is likely to rise.
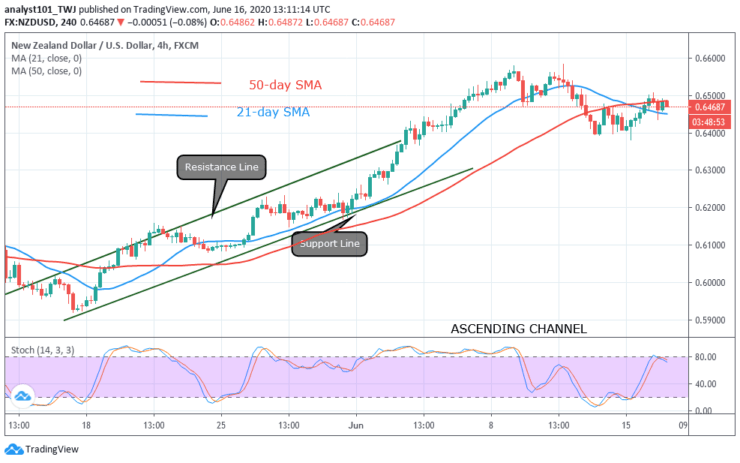
NZD /USD Medium-term Trend: Bullish
The Kiwi is in an ascending channel. Recently, it reaches a high of 0.66000 to form a bearish double top. This bearish signal caused the pair to fall to level 0.64000. The support is holding as the pair resumes the uptrend.
4-hour Chart Indicators Reading
Presently, the 21-day SMA and 50-day SMA are slowing upward indicating the upward move. The pair is above 75% range of the daily stochastic. The market is in a bullish momentum. The market is rising because of the recent correction.
General Outlook for NZD /USD
The Kiwi is in an uptrend. The market is also approaching the overbought region. Sellers may also emerge to push prices down. The uptrend will resume later.
Note: Learn2.Trade is not a financial advisor. Do your research before investing your funds in any financial asset or presented product or event. We are not responsible for your investing results
- Broker
- Min Deposit
- Score
- Visit Broker

- Award-winning Cryptocurrency trading platform
- $100 minimum deposit,
- FCA & Cysec regulated

- 20% welcome bonus of upto $10,000
- Minimum deposit $100
- Verify your account before the bonus is credited
- Fund Moneta Markets account with a minimum of $250
- Opt in using the form to claim your 50% deposit bonus
Learn to Trade
Never Miss A Trade Again

Signal Notification
Real-time signal notifications whenever a signal is opened, closes or Updated

Get Alerts
Immediate alerts to your email and mobile phone.

Entry Price Levels
Entry price level for every signal Just choose one of our Top Brokers in the list above to get all this free.