Don’t invest unless you’re prepared to lose all the money you invest. This is a high-risk investment and you are unlikely to be protected if something goes wrong. Take 2 minutes to learn more
Price movement in the NEOUSDT market rebounded in the previous session with moderate momentum. However, trading activity in the market today seems to be an improvement over what was observed in the previous session.
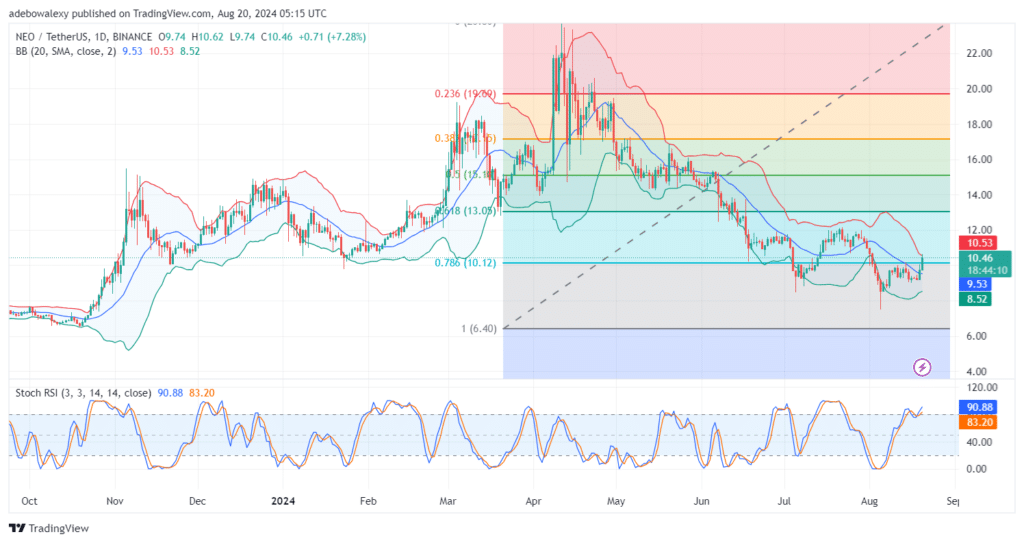
NEOUSDT Upside Retracement Pokes Through the 78.60 Fibonacci Level
As NEO’s price action continues to rise, it has surpassed both the middle limit of the Bollinger Bands (BB) indicator and the 78.60 Fibonacci Retracement Level.
The trajectory of the BB indicator appears to be adjusting, taking on a sideways path due to the recent market movements. Additionally, the Stochastic Relative Strength Index (SRSI) indicator is still rising into the overbought region, affirming that upside forces are still controlling price movement.
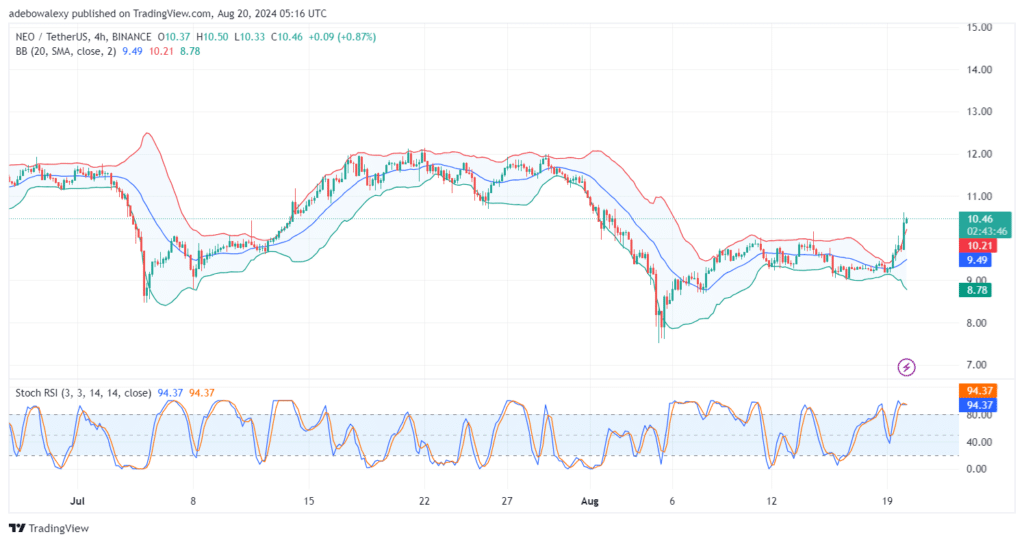
NEO Market Bulls Show Tenacity
The NEOUSDT 4-hour price chart reveals that upward forces continue to propel the market higher, even after the price action has surpassed the uppermost limit of the BB indicator. This suggests that the market may be targeting the next technical resistance level.
Meanwhile, the SRSI indicator shows a sideways trajectory in the oversold region, indicating that upward forces remain active. Therefore, traders can still utilize crypto signals targeting around the $11.50 price level for short-term gains.
Trade on MT4 with Leverage up to 1:500! Trade on MT4 with Leverage up to 1:500!
X
We use cookies to ensure that we give you the best experience on our website. If you continue to use this site we will assume that you are happy with it.