NEO Price Analysis – February 08
A further increase in the bears’ pressure may penetrate the two dynamic support level downside and decrease to $22 price level, it may extend to $19 and $15 levels. Bullish movement may continue in case the price could not break down dynamic support level and the resistance above the current price is found at $25, $28 and $32.
NEO/USD Market
Key Levels:
Resistance levels: $25, $28, $32
Support levels: $22, $19, $15
NEO/USD Long-term Trend – Bearish
NEOUSD is bearish in the daily chart. The price action has formed a short “M” pattern; the chart pattern formed is a bearish signal pattern. It means there is tendency for the NEO to fall to previous low at $15 provided the bears intensify their pressure. The price is currently descending below the $25 resistance level.
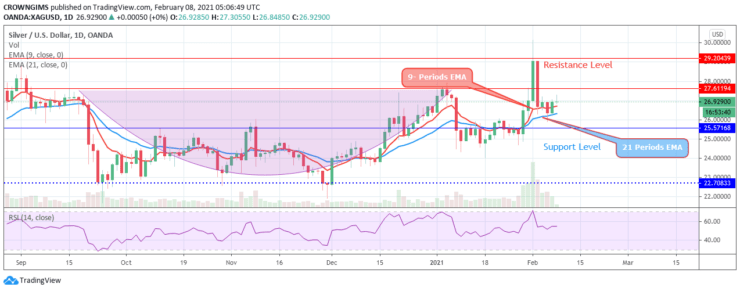
The two EMAs are separated from each other and the coin is trading above the 9 periods EMA and 21 periods EMA at close range. A further increase in the bears’ pressure may penetrate the two dynamic support level downside and decrease to $22 price level, it may extend to $19 and $15 levels. Bullish movement may continue in case the price could not break down dynamic support level and the resistance above the current price is found at $25, $28 and $32.
NEO/USD Medium-term Trend – Bearish
The bears are prevailing over the bulls. The bulls’ momentum and the bears’ momentum were equal last week on the 4-hour chart. The price initially rise after the consolidation towards the resistance level at $25. There was a partial breakout at the mentioned level on February 05. at equilibrium in the 4-hour chart. A “Tweezer top” candle pattern appeared, the bearish movement continues below the dynamic support level.
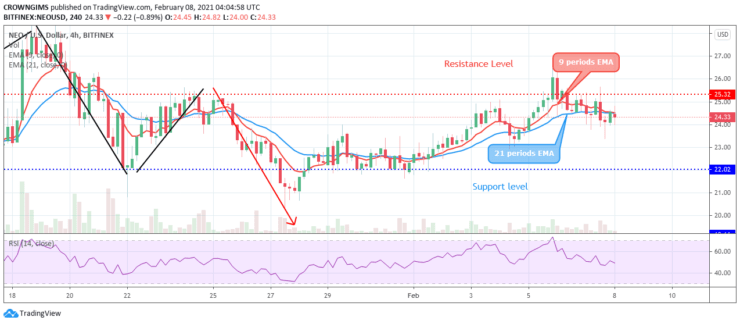
The price is crossing the 9 periods EMA and 21 periods EMA downside. The relative strength index period 14 is displaying a bearish signal at 50 levels.
- Broker
- Min Deposit
- Score
- Visit Broker

- Award-winning Cryptocurrency trading platform
- $100 minimum deposit,
- FCA & Cysec regulated

- 20% welcome bonus of upto $10,000
- Minimum deposit $100
- Verify your account before the bonus is credited
- Fund Moneta Markets account with a minimum of $250
- Opt in using the form to claim your 50% deposit bonus
Learn to Trade
Never Miss A Trade Again

Signal Notification
Real-time signal notifications whenever a signal is opened, closes or Updated

Get Alerts
Immediate alerts to your email and mobile phone.

Entry Price Levels
Entry price level for every signal Just choose one of our Top Brokers in the list above to get all this free.