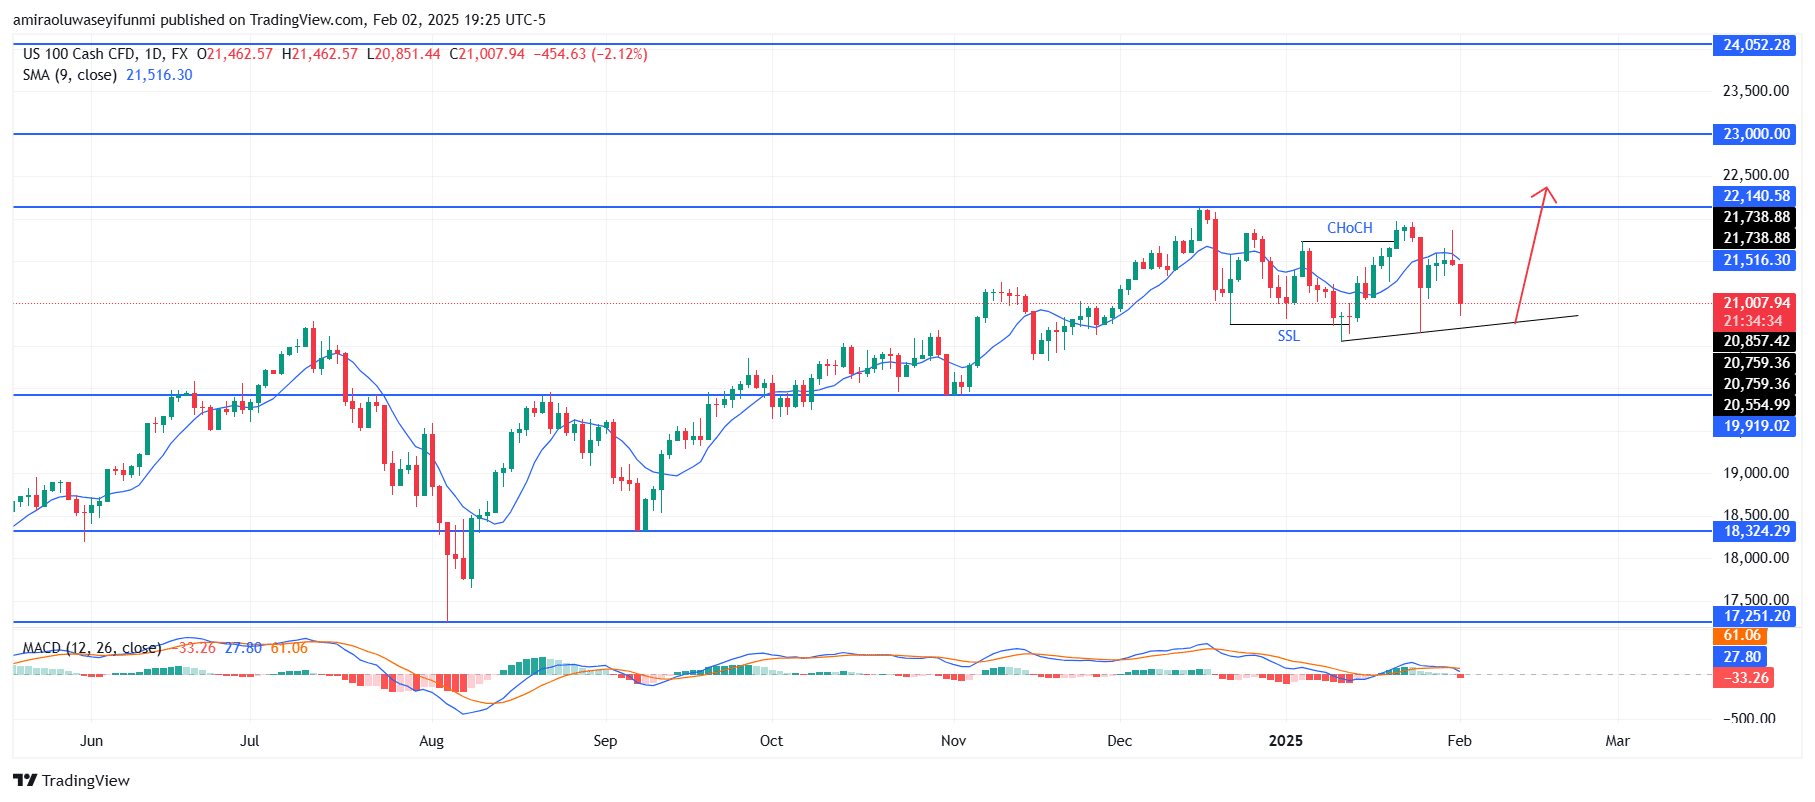
NAS100 finds support, signaling a potential bullish reversal in the coming days. Technical indicators suggest a shift in momentum for NAS100. The 9-period Simple Moving Average (SMA) is at $21,520, with the price trading below it, indicating short-term bearish pressure. However, the MACD histogram shows weakening bearish momentum, with the MACD line at 27.66 and the signal line at 61.03, suggesting that selling pressure is diminishing. If the MACD line crosses above the signal line, it would confirm a bullish reversal.
NAS100 Key Levels
Resistance Levels: $22,140.0, $23,000.0, $24,050.0 Support Levels: $19,920.0, $18,320.0, $17,250.0
NAS100 Long-Term Trend: Bullish
NAS100 is forming a higher low structure, with strong support around $20,550. The recent swing low held above this level, indicating buyers are stepping in. A Change of Character (CHoCH) has occurred, signaling a potential trend shift. Additionally, price rejection from lower levels and the maintenance of trendline support suggest a bullish resurgence. Resistance is currently observed at $22,140, aligning with previous highs.
Looking ahead, if NAS100 respects the rising trendline and breaks above the SMA, bullish momentum could push the price beyond $22,140. A breakout above this level would pave the way for a rally toward $23,000 and potentially $24,050 in the longer term. However, if the price falls below the trendline, a deeper retracement toward $19,920 could occur before a significant bullish move resumes.
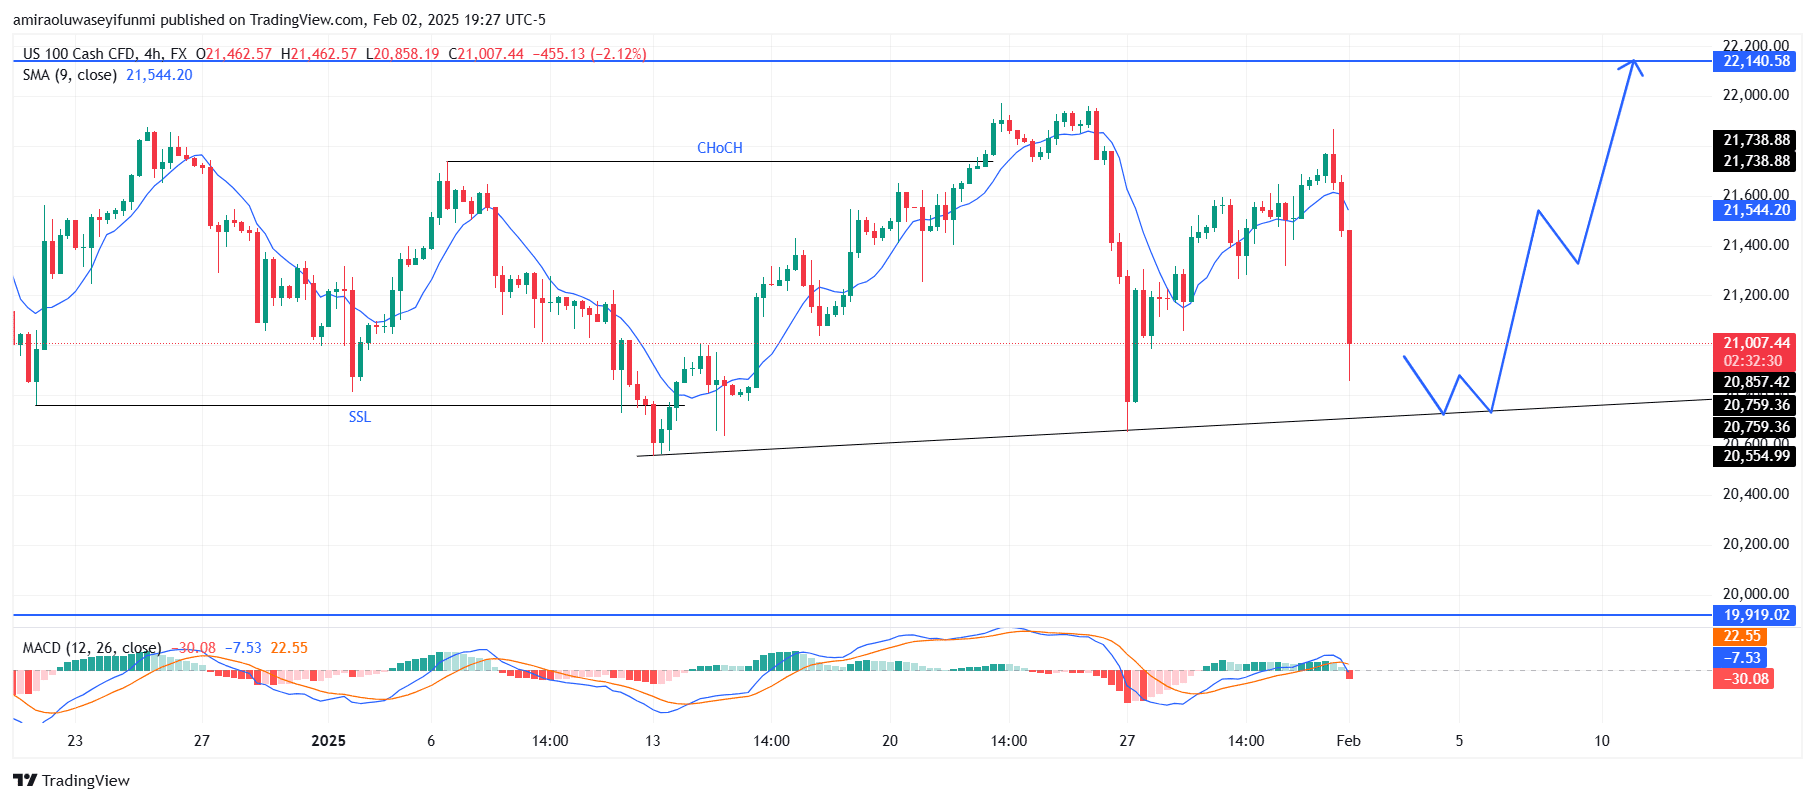
NAS100 Short-Term Trend: Bullish
NAS100 is currently retracing and approaching the rising trendline, which has served as strong support. The 9-period SMA at $21,540 is above the price, confirming short-term bearish pressure. However, a bounce from the trendline could trigger bullish momentum. The MACD histogram remains negative, indicating selling pressure, but a reversal near $20,550 or higher could shift momentum upward. With forex signals suggesting potential market shifts, traders are closely monitoring price action for confirmation of a bullish move.
Note: Learn2.trade is not a financial advisor. Do your research before investing your funds in any financial asset, product, or event. We are not responsible for your investment results.
Trade on MT4 with Leverage up to 1:500! Trade on MT4 with Leverage up to 1:500!
X
We use cookies to ensure that we give you the best experience on our website. If you continue to use this site we will assume that you are happy with it.