Market Analysis – April 15th
Nasdaq has emerged as a standout performer in the financial markets since the close of the preceding year. The market structure of Nasdaq has been notably characterized by well-defined swing lows preceding swing highs. However, in recent developments, the Nasdaq has dipped below the supporting trendline on the daily chart.
Key Levels for Nasdaq 100:
Demand Levels: 16996.0, 16177.0, 15776.0
Supply Levels: 18474.0, 19000, 20,000.
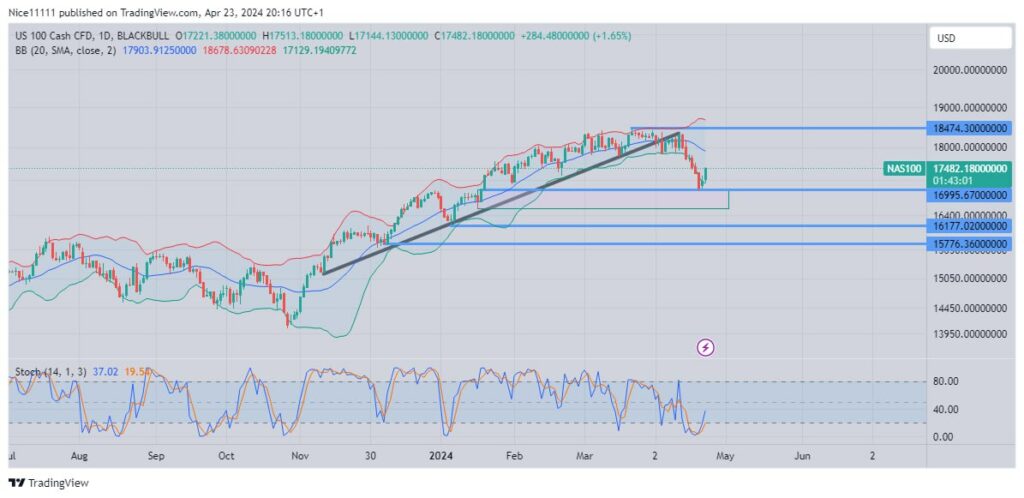
Long-Term Trend for Nasdaq: Bearish
Since November of the previous year, the majority of daily candles have closed above the Moving Average within the Bollinger bands, indicating a bullish stance. Nevertheless, recent days have witnessed a departure from this trend, marked by a consistent downward trajectory in daily prices. The rapid decline culminated in the identification of three black crows, ultimately leading the price to the support zone of 16995.0.
Short-Term Trend for Nasdaq: Bearish
On the daily chart, the Stochastic oscillator has signaled an oversold market, prompting a swift reaction. After testing the zone, bullish trading days have ensued.
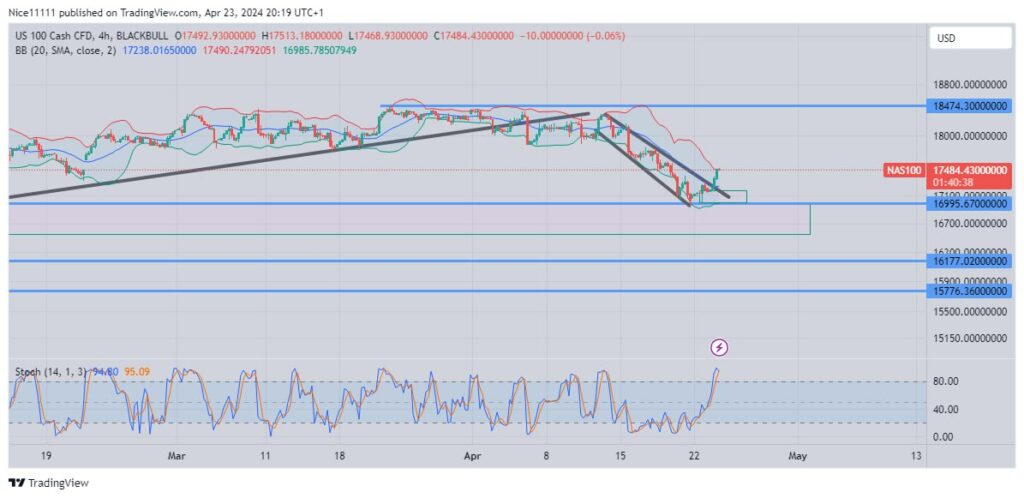
Meanwhile, the Stochastic on the 4-hour chart indicates an overbought price, reflective of the upward momentum experienced following the test of the demand zone. Notably, a bullish shift in market structure has been observed on the 4-hour chart, indicating anticipation of a rise towards 18474.0.
You can purchase Lucky Block – Guide, Tips & Insights | Learn 2 Trade here. Buy LBLOCK
Note: Learn2.trade is not a financial advisor. Do your research before investing your funds in any financial asset or presented product or event. We are not responsible for your investing results
- Broker
- Min Deposit
- Score
- Visit Broker

- Award-winning Cryptocurrency trading platform
- $100 minimum deposit,
- FCA & Cysec regulated

- 20% welcome bonus of upto $10,000
- Minimum deposit $100
- Verify your account before the bonus is credited
- Fund Moneta Markets account with a minimum of $250
- Opt in using the form to claim your 50% deposit bonus
Learn to Trade
Never Miss A Trade Again

Signal Notification
Real-time signal notifications whenever a signal is opened, closes or Updated

Get Alerts
Immediate alerts to your email and mobile phone.

Entry Price Levels
Entry price level for every signal Just choose one of our Top Brokers in the list above to get all this free.