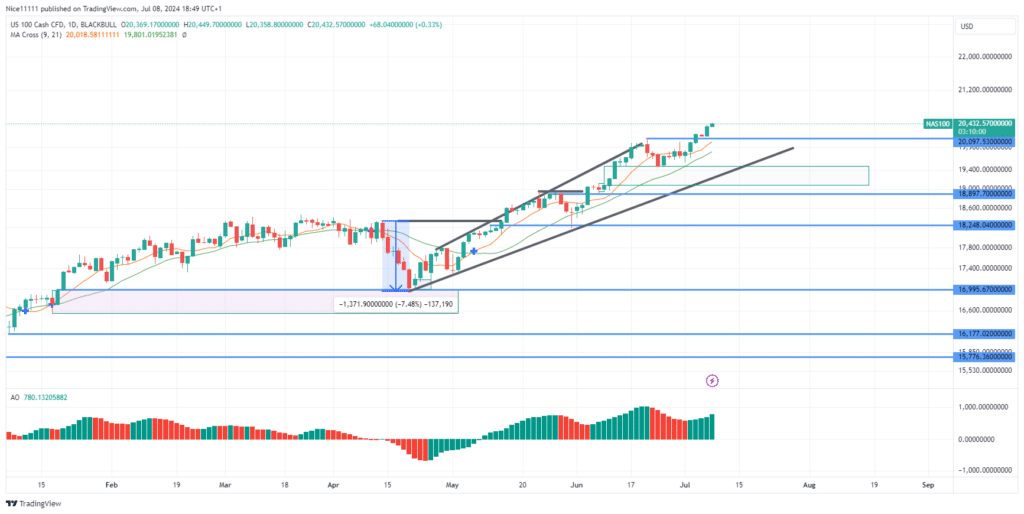
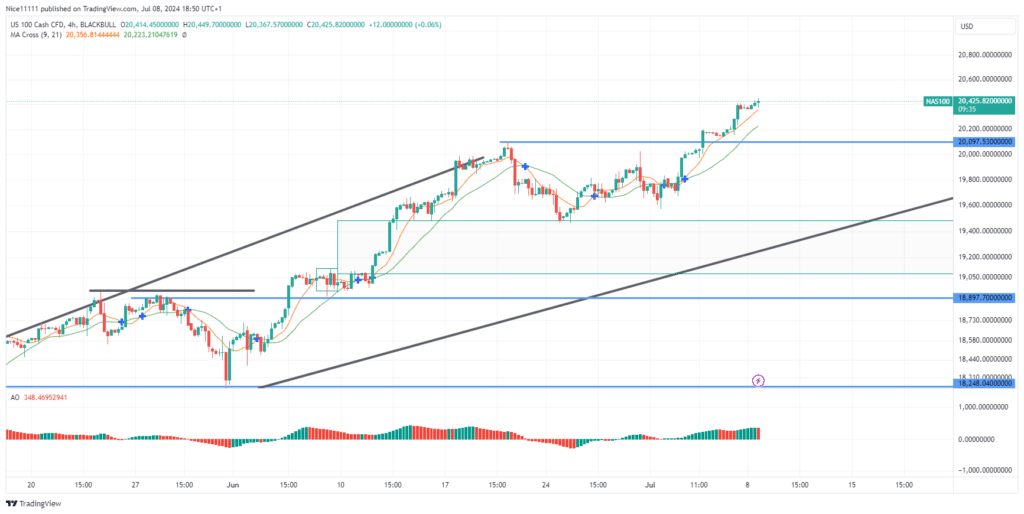
The Nasdaq 100 has exhibited a pronounced upward trajectory, as evidenced by the recent breach of the previous swing high at 20,097.0 on the daily chart. This movement has been supported by the formation of a bullish order block at the point of the current bullish structure break. Such a configuration generally indicates a strong potential for continued upward momentum in price action in the near term.
June’s market price action highlighted a significant pattern, with the index retracing to a fair value gap at 19,400.0. Notably, the price ascended from this level without delving deep into the gap, a move often associated with institutional order flow and termed as an ‘Entry drill’.
Despite a slight dip below the Moving Average of period nine, the price maintained its position above the Moving Average of period twenty-one, reinforcing the bullish sentiment. This was followed by a surge past the swing high of 20,097.0, with the Awesome Oscillator signaling heightened bullish momentum.
Nasdaq 100 Short-Term Trend: Bullish
The daily and 4-hour charts reveal that the Moving Averages of periods nine and twenty-one are positioned beneath the candlesticks, a typical sign of an ongoing bullish phase. With these indicators suggesting that the buyers are maintaining control, an expansion in price is anticipated, underscoring the Nasdaq 100’s potential for continued growth. Incorporating forex signals can offer additional insights into this bullish momentum, helping traders optimize their strategies.
Note: Learn2.trade is not a financial advisor. Do your research before investing your funds in any financial asset, product, or event. We are not responsible for your investment results.
Trade on MT4 with Leverage up to 1:500! Trade on MT4 with Leverage up to 1:500!
X
We use cookies to ensure that we give you the best experience on our website. If you continue to use this site we will assume that you are happy with it.