Nasdaq 100 ended Friday’s trading activities under the $11,725 price level. However, technical indicators appear to be predicting that the NAS100 price may resume moving upward once trading activities for the new week begin.
Important price Levels:
Ceiling Levels: $11,620, $11,700, $11,780
Floor Levels: $11,563, $11,500, $11,450
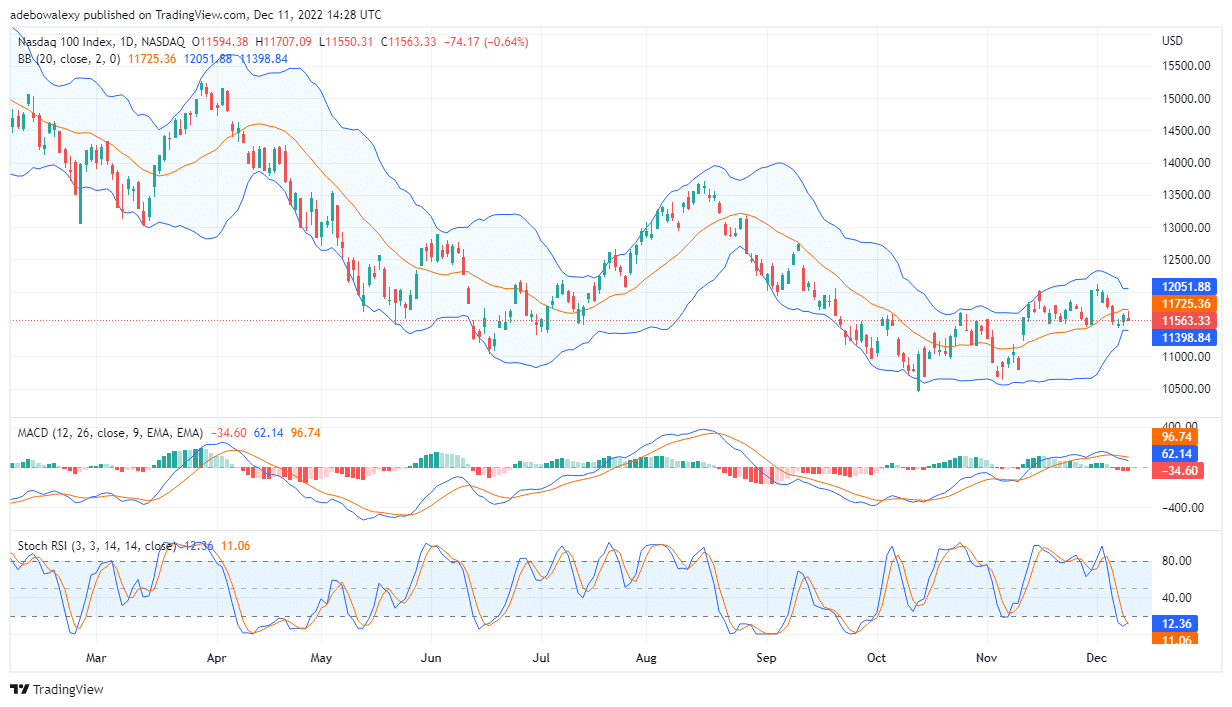
Nasdaq 100 Price Prediction Today December 11, 2022: NAS100/USD Seems Poised to Crack Resistance $11,725
NAS100/USD price closed under the resistance of $11,725 on Friday. Nevertheless, signs arising from technical indicators on the daily Nasdaq 100 chart, look positive. The Moving Average Convergence Divergence indicator on this chart is now above the equilibrium level. Additionally, the lines of this Indicator have performed a crossover which ought to indicate a decisive change in price trend, however, these lines appear to be generally moving sideways instead. Also, the lines of the Stochastic Relative Strength indicator seem to be at the initial stage of a bullish crossover. Consequently, it is more likely that price action rises upward once trading activities resume.
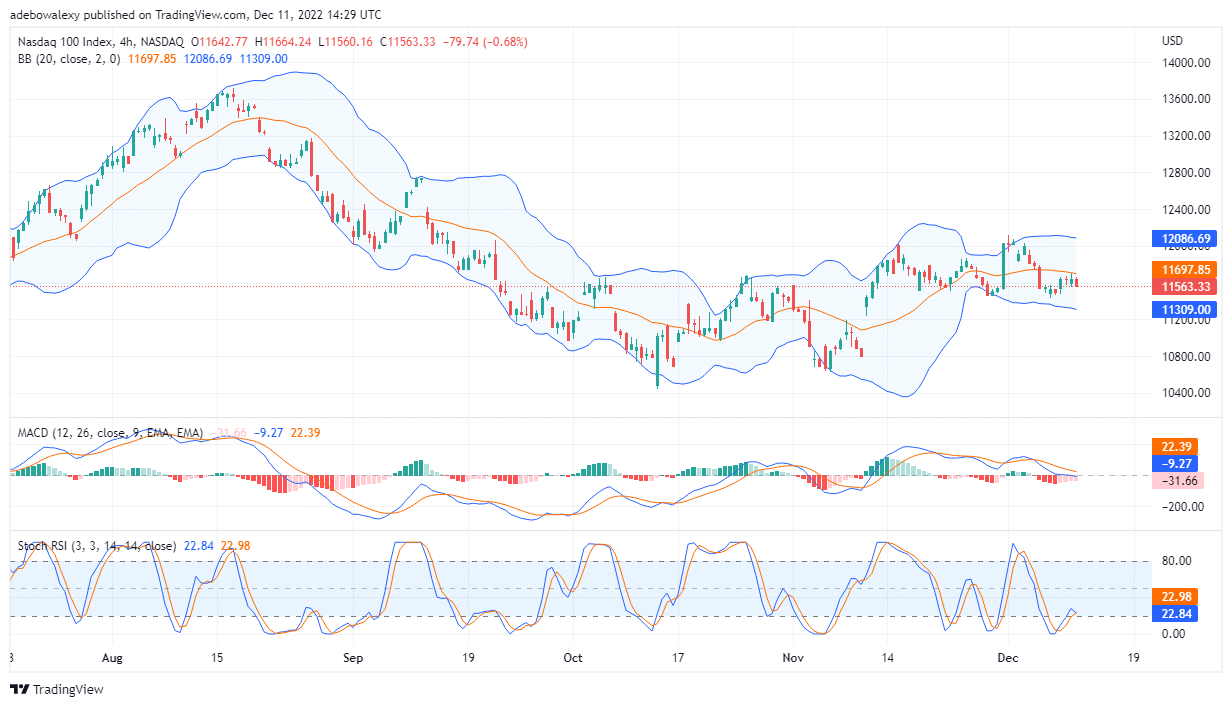
Nasdaq 100 Price Prediction Today December 11, 2022: Trading Indicators on the NAS100/USD Market Seems Divergent
On the 4-hour NAS100/USD market, technical indicators seem to be a bit divergent about the anticipated market direction – going by this article. The RSI curves are already in position for a bearish crossover around the 22.00 level. By implication, this indicator is predicting future price decreases. Meanwhile, the MACD indicator differs a bit on this opinion. On the MACD we can see that the lines of this Indicator seem to be moving generally sideways. Additionally, the histogram of the MACD below the 0.00 level is now looking pale to indicate a decline in the market’s downward momentum. Therefore, buyers may have the upper hand in the coming trading session. Consequently, traders can predict that Nasdaq 100 price may move toward the $12,000 price level.
Do you want to take your trading to the next level? Join the best platform for that here
- Broker
- Min Deposit
- Score
- Visit Broker

- Award-winning Cryptocurrency trading platform
- $100 minimum deposit,
- FCA & Cysec regulated

- 20% welcome bonus of upto $10,000
- Minimum deposit $100
- Verify your account before the bonus is credited
- Fund Moneta Markets account with a minimum of $250
- Opt in using the form to claim your 50% deposit bonus
Learn to Trade
Never Miss A Trade Again

Signal Notification
Real-time signal notifications whenever a signal is opened, closes or Updated

Get Alerts
Immediate alerts to your email and mobile phone.

Entry Price Levels
Entry price level for every signal Just choose one of our Top Brokers in the list above to get all this free.