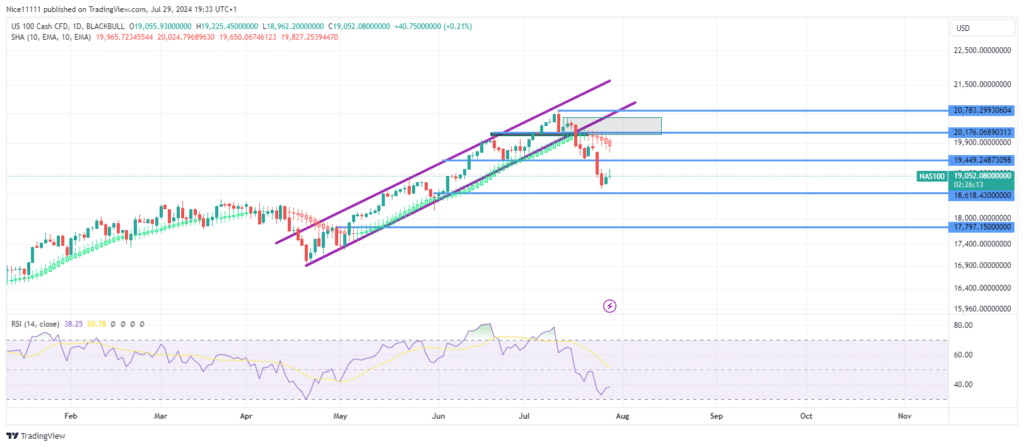
The Nasdaq 100 has continued its decline following the failure of the demand zone at 19,449.0 to hold. A new lower high has been established, offsetting short orders and confirming a bearish trend.
The Nasdaq 100 has shifted to a bearish direction with a breakout from the bullish parallel channel on the daily chart. The RSI (Relative Strength Index) indicated the market was overbought just before this bearish breakout. Shortly after the RSI signaled an overbought condition, the Smoothed Heikin Ashi Candle turned red as the daily candles dropped below the Smoothed Heikin Ashi Candles.
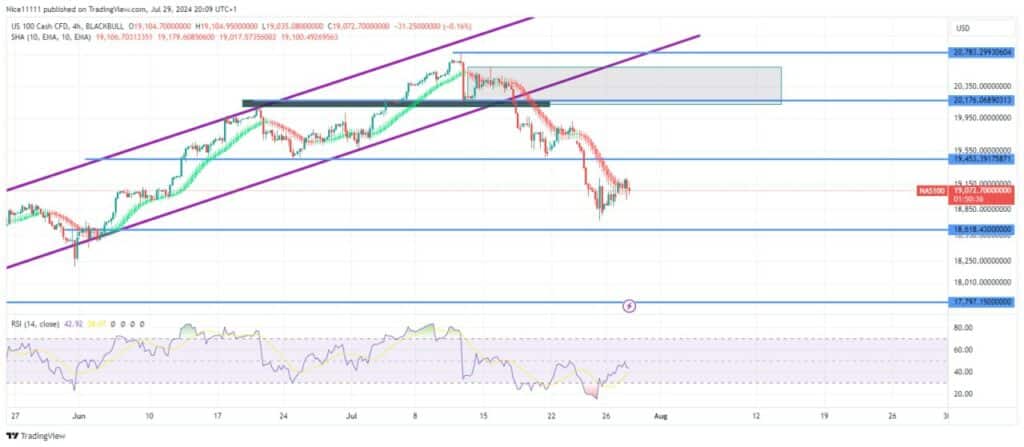
After reaching the demand zone at 19,453.0, the price pulled back to the Smoothed Heikin Ashi Candles, which acted as resistance, leading to the break of the 19,453.0 demand level. The price is currently moving towards liquidity regions on the buy-side delivery of the market, as suggested by various forex signals.
Nasdaq Short-Term Trend: Bearish
A bearish order block is present above the supply zone at 19,453.0. The previous demand level of 19,453.0 has now turned into a supply zone due to the break. The lower demand zone at 18,618.0 appears to be a realistic target based on prominent forex signals.
Note: Learn2.trade is not a financial advisor. Do your research before investing your funds in any financial asset, product, or event. We are not responsible for your investment results.
Trade on MT4 with Leverage up to 1:500! Trade on MT4 with Leverage up to 1:500!
X
We use cookies to ensure that we give you the best experience on our website. If you continue to use this site we will assume that you are happy with it.