Wall Street’s top-three indexes rose earlier this week as investors anticipated a loose monetary policy by the Federal Reserve. However, all weekly gains were erased as the central bank failed to provide any concrete details concerning its stimulus plans.
The SPX and the Nasdaq Composite (IXIC) have come under pressure as investors dump high-flying tech-related stocks for industrial and transportation firms.
Out if the eleven major S&P indexes, industrials (SPLRCI), materials (SPLRCM), and energy (SPNY) have risen by more than 2% over the week, while communication services (SPLRCL), and consumer discretionary (SPLRCD) have recorded significant declines.
Meanwhile, Tesla Inc (NASDAQ: TSLA) grew by 2.1% in pre-market trading following some analysts’ decision to up their price targets on the electric carmaker’s shares as we head into the highly-anticipated “Battery Day” event next week.
In other news, volatility will likely be erratic today given the quarterly expiration of the US stock options, index futures, and options contracts.

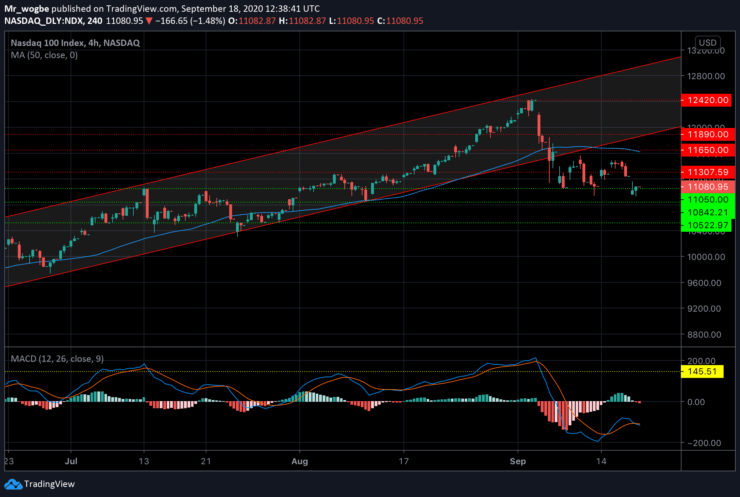
Nasdaq 100 (NDX) Value Forecast — September 18
NDX Major Bias: Sideways
Supply Levels: 11305, 11650, and 11890.
Demand Levels: 11150, 11050, and 10840.
The NDX was wracked with heavy selling yesterday but was later saved by the 10950 support in the mid-North American session on Thursday. The index witnessed a modest rebound to the 11130 area, where it currently trades at press time (pre-market).
If the index can hold above this level, we could see it reclaim the 11650 resistance, where a confluence of indicators lay (11650 resistance and 50 SMA). It seems likely that this could be the case considering that it is in neutral territories on our MACD indicator.
Note: Learn2.Trade is not a financial advisor. Do your research before investing your funds in any financial asset or presented product or event. We are not responsible for your investing results
- Broker
- Min Deposit
- Score
- Visit Broker
- Award-winning Cryptocurrency trading platform
- $100 minimum deposit,
- FCA & Cysec regulated
- 20% welcome bonus of upto $10,000
- Minimum deposit $100
- Verify your account before the bonus is credited
- Fund Moneta Markets account with a minimum of $250
- Opt in using the form to claim your 50% deposit bonus
Learn to Trade
Never Miss A Trade Again

Signal Notification
Real-time signal notifications whenever a signal is opened, closes or Updated

Get Alerts
Immediate alerts to your email and mobile phone.

Entry Price Levels
Entry price level for every signal Just choose one of our Top Brokers in the list above to get all this free.


