Key Resistance Zones: 15000, 15500, 16000
Key Support Zones: 13500, 13000, 12500
NASDAQ 100 (NAS100) Long-term Trend: Bearish
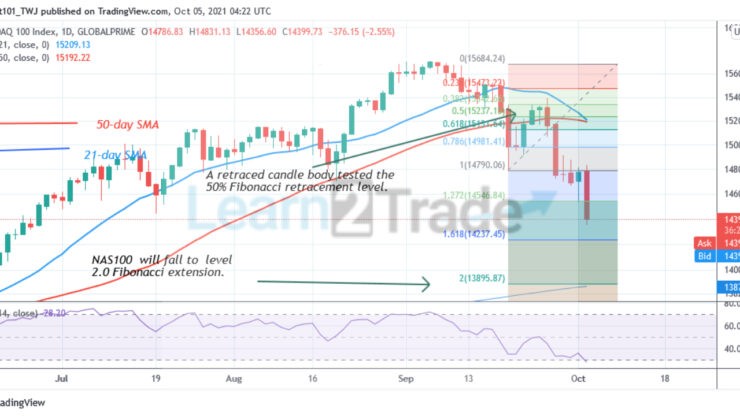
NAS100 index has been in a downward move after reaching a peak price of level 15711. The market has declined to the bearish trend zone as bears broke below the moving averages. The selling pressure has been accelerated as price reached the low of level 14356. A further downward move is likely because of the rejection at level 14800. Meanwhile, on September 20 downtrend, a retraced candle body tested the 50% Fibonacci retracement level. The retracement indicates that NAS100 is likely to fall to level 2.0 Fibonacci extensions or level 13895.87.
Daily Chart Indicators Reading:
NAS100 is at level 29 of the Relative Strength period 14. It indicates that the market has reached the oversold region. The implication is that selling pressure has subsided. Buyers are likely to emerge in the oversold region to push prices down. The price bars are below the 50-day SMA and the 21-day SMA indicating the downtrend.
NASDAQ 100 (NAS100) Medium-term Trend: Bearish
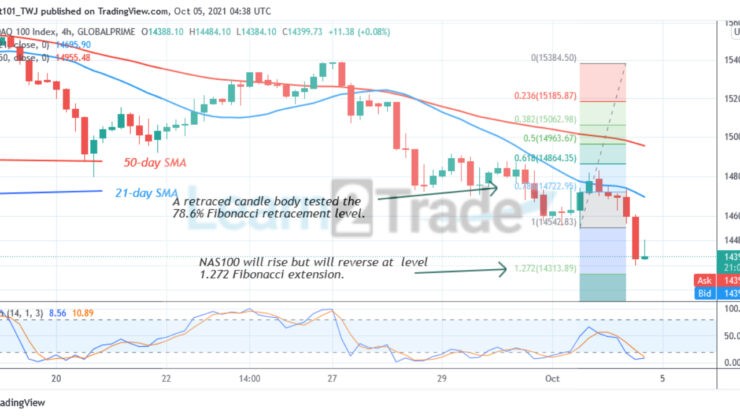
On the 4- hour chart, NAS100 is in a downward move. The downtrend was accelerated after a rejection at level 15400. Meanwhile, on September 30 downtrend, a retraced candle body tested the 78.6% Fibonacci retracement level. The retracement indicates that NAS100 is likely to fall to level 1.272 Fibonacci extension or level 14313.89 .
4-hour Chart Indicators Reading
The index is below the 20% range of the daily stochastic. It indicates the market has reached the oversold region. Also, the selling pressure is reaching bearish exhaustion. The 21-day SMA and the 50-day SMA are sloping downward indicating the downtrend.
General Outlook for NASDAQ 100 (NAS100)
NAS100 has reached an oversold region of the market. The downtrend is likely to subside. As buyers emerge, the upward move will resume. The market has started holding above level 14400.
You can purchase crypto coins here: Buy Token
Note: Learn2.Trade is not a financial advisor. Do your research before investing your funds in any financial asset or presented product or event. We are not responsible for your investing results
- Broker
- Min Deposit
- Score
- Visit Broker

- Award-winning Cryptocurrency trading platform
- $100 minimum deposit,
- FCA & Cysec regulated

- 20% welcome bonus of upto $10,000
- Minimum deposit $100
- Verify your account before the bonus is credited
- Fund Moneta Markets account with a minimum of $250
- Opt in using the form to claim your 50% deposit bonus
Learn to Trade
Never Miss A Trade Again

Signal Notification
Real-time signal notifications whenever a signal is opened, closes or Updated

Get Alerts
Immediate alerts to your email and mobile phone.

Entry Price Levels
Entry price level for every signal Just choose one of our Top Brokers in the list above to get all this free.