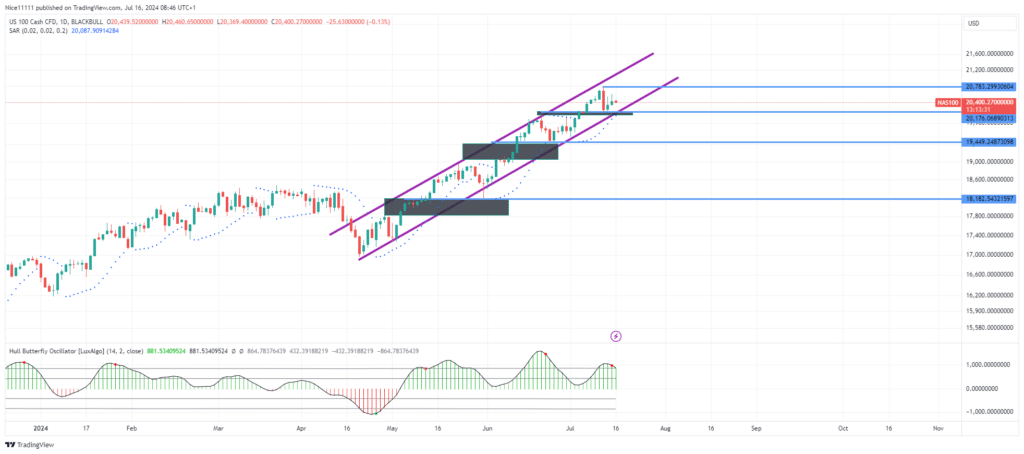
The Nasdaq 100 price has retraced to the support level of 20,176.0. This pullback has effectively covered the region of the fair value gap, revealing underlying market inefficiencies. The gap was created above the down-close candle on July 5th. Such a retracement not only indicates a corrective phase but may also establish a foundation for a subsequent upward price continuation, suggesting potential buying opportunities for traders and investors.
The recent decline in price from the swing high of 20,783.0 appears to be a healthy correction within the broader bullish trend. The Parabolic SAR (Stop and Reverse) points remain positioned below the daily candles, affirming the prevailing upward trajectory. This technical indicator continues to support the bullish outlook, signaling that the upward momentum is still intact.
Additionally, the Hull Butterfly Indicator reveals that buyers maintain control, with its positive reading above zero. A comprehensive analysis of the daily chart since mid-April demonstrates that pullbacks have been a consistent pattern, often preceding further upward price movements. This pattern reinforces the expectation of continued bullish momentum over the long term.
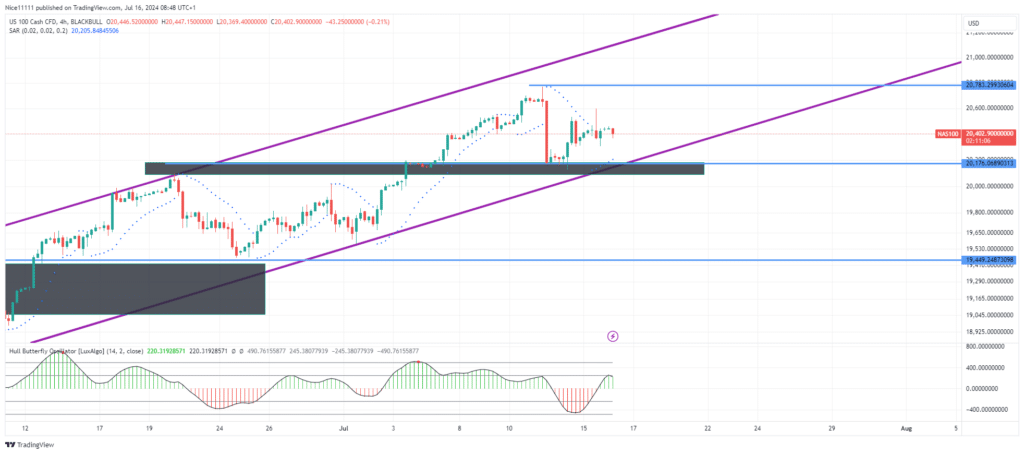
Nasdaq 100 Short-Term Trend: Bearish
In the short term, the price has rebounded from the supporting border of the parallel channel. This rebound is anticipated to facilitate an ascent that could potentially surpass the previous high of 20,783.0. The short-term bearish trend, characterized by this pullback, is viewed as a temporary correction within the overall bullish market structure. Forex signals can provide valuable insights for traders navigating these trends.
Note: Learn2.trade is not a financial advisor. Do your research before investing your funds in any financial asset, product, or event. We are not responsible for your investment results.
Trade on MT4 with Leverage up to 1:500! Trade on MT4 with Leverage up to 1:500!
X
We use cookies to ensure that we give you the best experience on our website. If you continue to use this site we will assume that you are happy with it.